WORKSHOP: Innovation Based Manufacturing

Presented by the Institute of Critical Technologies and Applied Science (ICTAS) at Virginia Tech

Workshop Description:

The Oslo Manual defines innovation as “is the implementation of a new or significantly improved product (good or service), or process, a new marketing method, or a new organizational method in business practices, workplace organization or external relations.” This definition makes clear that innovation is not just the creation of a new product but also the strategic improvement of internal processeses such as manufacturing. This workshop will give you an understanding of why innovation based manufacturing is critical to achieve economic development and how it can be pursued.

The morning session of the workshop will expose participants the basic concepts of innovation based manufacturing and how current developments in policy, economic development, and open innovation relate to the practice of innovation in manufacturing. The afternoon session will focus on innovation tools and how these tools can be used to developed innovative manufacturing solutions.

The workshop will also serve as the presentation of the recently established Center for Innovation Based Manufacturing (CIbM) at Virginia Tech.

Workshop Outline (subject to changes):

  • Opening remarks. Dr. Jaime Camelio, Director of CIbM at Virginia Tech. 8:30 am-8:45 am
  • Innovation Based Manufacturing. Dr. Roop Majahan, Director of ICTAS at VA Tech. 8:45 am-9:15 am
  • Innovation Policy. Dr. Julia Lane, National Science Foundation. 9:15 am- 9:45 am
  • Break. 9:45 am-10:05 am
  • Innovation and Economic Development. Dr. Darrene Hackler. 10:05 am-10:45 am
  • Innovation practices in Action. Dr. Antje Lembcke. Director Gas Turbine Engineering at Siemens. 10:45 am-11:20 am
  • Panel discussion. Dr. Jaime Camelio, Director of CIbM at Virginia Tech. 11:20 am-12:00 pm
  • Lunch. 12:00 pm-1:00 pm
  • Innovation Lab, Part 1. Dr. Jose M. Vicente-Gomila. Polytechnic Institute of Valencia. 1:00 pm-2:30 pm
  • Break. 2:30 pm-2:50 pm
  • Innovation Lab, Part 2. Dr. Jose M. Vicente-Gomila. Polytechnic Institute of Valencia. 2:50 pm-4:00 pm
  • Adjourn. Dr. Jaime Camelio. 4:00 pm-4:10 pm.

Workshop Objectives:

  • Understand the basics of innovation based manufacturing
  • Comprehend how innovation policy plays a key role in economic development
  • Understand the impact of open innovation in manufacturing solutions
  • Recognize the main aspects of embedding innovation into an organization’s structure
  • Learn innovation tools to support manufacturing solutions

Who Should Attend:

  • Anyone who would like to learn about the innovation process and how to use it to increase business competitiveness and achieve long term sustainability.
  • Entrepreneurs, Investors, Policy Makers, Process and Products Engineers, Plant Managers, Process Improvement Managers, Marketing Managers, General Managers, and Financial Managers.

Location, Date and Registration:

  • Date: November 11, 2010
  • Time: 8:30 a.m. to 4:10 p.m.
  • Location: The Inn at Virginia Tech, Blacksburg, VA
  • Investment: $125. Includes coffee breaks, lunch and workshop materials

Registration:

  • $125. Please go to http://www.cpe.vt.edu/reg/ibmw/ for online registration. If you wish to pay by check, please let us know to send you a registration form.

Further Information:

Please visit our web page at http://www.cibm.ise.vt.edu/ for more information on the CIbM. Contact Dr. Henry Quesada at quesada@vt.edu or at (540)231-0978 if you have any questions about the workshop.

RESEARCH BRIEF: The Forest Products Industry of the Appalachian Region

by Scott Lyon, MS Candidate
Virginia Tech

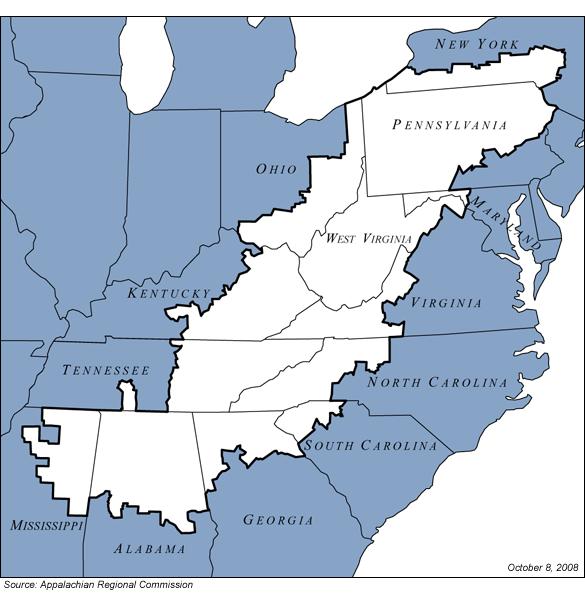
The Appalachian region consists of 205,000 square miles from southern New York to northern Mississippi, also including Pennsylvania, Ohio, Maryland, West Virginia, Virginia, North Carolina, South Carolina, Tennessee, Kentucky, Georgia, and Alabama (Figure 1; Appalachian Regional Commission 2010).  The economy in this region was fueled historically by forestry, mining, farming and industry and currently, the region is primarily involved in a mix of manufacturing and service industries (Appalachian Regional Commission 2010). Because of diversifying the economy, the amount of distressed counties in the region has been reduced from 223 in 1965 to 82 counties in 2010 (Appalachian Regional Commission 2010).

Figure 1. Appalachian Region Map (ARC 2010)

The manufacturing of forest products in this region is an essential sector of the economy employing over 1.1 million people (Murphy et al. 2008; NC-IOF & NCFA 2003; NESFA 2001; SCFC 2006; Ammerman Unknown Date; PFPA 2005; Young et al. 2007; VDACS 2008; Childs 2005; EDPA 2010; Ervin et al. 1994, McClure 2008, Mississippi State University 2010).  An increase in global competition has caused the decrease of domestic markets for U.S. furniture and this increase of competition has taken a toll on the Appalachian hardwood lumber industry (Bowe et al. 2001). The forest products industry in the Appalachian region must be innovative in their marketing strategies to find potential markets for their products (Naka et al. 2009). Other factors affecting the forest products industry has been urbanization, land development and population growth that have decreased the amount of timber available to the forest products industry (Young et al. 2007). 

 The hardwood industry in Pennsylvania is the top producer of hardwood lumber in the country manufacturing 10% of the total production in the United States (PFPA 2005; Smith et al 2003). Alabama ranks number two in timberland resources with 23 million acres of forestland fueling 850 forest product mills (EDPA 2010).  Hardwood lumber mills range in size from producing 1 million board feet (MMBF) to over 40 MMBF a year (Smith et al 2004). Some Appalachian mills have increased the amount of value-added products/processes available to customers in order to increase market size and sales. These value-added processes include: kiln drying, custom sorting/grading, S4S, finger jointing, and dimension manufacturing (Smith et al. 2004).  Low grade sawlogs and small-diameter logs were not used traditionally in lumber production in the Appalachian region.  The introduction of oriented strandboard mills (OSB), parallel-strand lumber mills (PSL) and rotary-cut plywood mills have allowed the forest product industry to expand the use of low grade raw material and make it value-added product (Luppold et al. 1998).    

The forests in this region grow a large variety of hardwood and softwood timber species that are harvested for wide assortment of forest products (VDACS 2008).  A variety of hardwood timber species primarily grow in the Appalachian region (Table 1). These species are used in many different end-use applications including: pallets, furniture, flooring, cabinets and millwork (Adams 2002; Virginia Department of Forestry 2007). 

Table 1. Hardwood Species Grown in the Appalachian Region (Adams 2002, VDOF) 

Common Name Scientific Name
red oak Quercus rubra & Quercus falcate
white oak Quercus alba
hard maple Acer saccharum
soft maple Acer rubrum & Acer saccharinum
black walnut Juglans nigra
yellow-poplar Liriodendron tulipifera
black cherry Prunus serotina
American basswood Tilia americana

Softwood lumber species grown in this region include: Eastern white pine (Pinus strobus), and Southern Yellow Pine (Pinus palustris, P. elliotii, P. taeda, P. echinata).  These softwood species are primarily used as lumber for construction applications, furniture, cabinets, and other interior uses (Virginia Department of Forestry 2007). 

Not only does the forest have a significant impact on the region’s economy but it also helps control water and air quality creating benefits the local communities (Childs 2005; Virginia Department of Forestry 2007). Components of the forest ecosystem work together to reduce the amount of storm water runoff entering nearby watersheds.  In urban areas, forests help lower the amount of runoff by collecting it in leaves, branches and soils (American Forests Unknown Date).  Forests produce organic compounds that reduce the amount of air pollution in an area.  A study in Chicago, Illinois, found that urban trees helped decreased the amount of toxic emissions in the air surrounding the city (Nowak 1994). The Appalachian forests provide a variety of benefits to both humans and the environment.  The forest products industry provides to local economies with added jobs and revenues.  The forests also provide a renewable resource that can be sustainably harvested.

References:

Please email Scott Lyong at swlyon@vt.edu to request the list of references.

RESEARCH BRIEF: Engineering Change Orders (ECOs), an important engineering performance indicator

By Chao Wang, MS Candidate
Department of Wood Science and Forest Products
Virginia Tech

What are Engineering Change Orders (ECOs)?

ECOs are also called Engineering Change Notices (ECNs) or just Engineering Changes (ECs). ECOs are a significant driver of product development costs and lead time (Loch and Terwiesch 1999). Engineering changes (ECOs) refers to making design changes to an existing product (Barzizza, Caridi, and Cigolini 2001). It includes changes for improving production efficiency as well as the changes for assuring product quality and performance (Balakrishnan and Chakravarty 1996).

Types of ECOs

(Barzizza, Caridi, and Cigolini 2001) categorized ECOs as “scrap”, ”rework”, and ”use-as-is”. “scrap” means serious technical faults and user safety problem and needs to be solved immediately. “Scrap” will directly affect the work in progress (WIP) inventory since all these inventory cannot be applied to other products. ”Rework” means ECOs are required for improvements of pre-change WIP without affecting finished products and components. ”Use-as-is” means a product has no technical faults and user safety problem but need to improve product design.

Engineering Performance of Furniture Industry

Figure 1. Causes of Engineering Errors

ECOs are also one of the reflections of engineering performance in the furniture industry. According to our interview, furniture engineers spend over 50% of their available engineering time on issuing ECOs for late design changes and architecture modifications. ECOs could be classified as ECOs for engineering errors and ECOs for engineering improvements. Less engineering errors could not only ensure product quality, but also could shorten the time-to-market and reduce the production cost. In order to find what are the most frequently occurred errors, a Pareto analysis could help us to have an idea on what the major contributors are. Figure 1 showed a Pareto Analysis of the engineering performance of a solid wood furniture company. The ECOs data represents a single month in that company. The number of ECOs issued for correcting engineering errors accounted for 98.67% of all the ECOS issued during this month. The rest 1.33% were ECOs for product improvements. From Figure 1, we could observe that “drawing error”, “part dimension error” and “wrong selection of hardware” take over 80 percent of the total engineering errors (most critical ones according to Paretto Analysis). Specifically, “drawing error” accounts for 44% of all the errors. Followings are” part Dimension Error” which accounted for 32%, “Wrong selection of hardware” accounted for 10%, “Hardware missing” accounted for 9%, “Wrong numbers of hardware” accounted for 3%, “Dimension missing” and “Missing drawings” both accounted for 1%.

Knowing what are the major causes of engineering error is important because ECOs (for correcting the engineering errors) are a type of waste which requires a lot of rework and iteration period. The Pareto Analysis can help us to find the major causes, and then we could try to find effective methods to eliminate these wastes.

Reference:

  • Balakrishnan, N., and A. K Chakravarty. 1996. Managing engineering change: Market opportunities and manfucturing costs. Production and Operations Management 5, no. 4.
  • Barzizza, R., M. Caridi, and R. Cigolini. 2001. Engineering change: a theoretical assessment and a case study. Production Planning & Control 12, no. 7: 717–726.
  • Loch, C. H, and C. Terwiesch. 1999. Accelerating the process of engineering change orders: capacity and congestion effects. Journal of Product Innovation Management 16, no. 2: 145–159.

RESEARCH BRIEF: Statistics for the Pallet Industry sector in US

By Leslie Scarlett Sanchez, MS Candidate
Department of Wood Science and Forest Products
Virginia Tech
 

Pallets

Pallets are the interface between packaging and the unit load handling equipment (White & Hamner, 2005). Another simpler definition is that pallets are “portable platforms”, which facilitates the movement and storage of unitized goods (Kator, 2008).

Unit loads are also important to define, as the system comprised of pallets, packaging materials, and unit load stabilizers (stretch wrap, tie sheets, corner posts, load adhesives, and strapping).

Pallet Sizes

The growth of domestic and international trade, the need to plan operations for the transportation, warehousing, and handling of materials throughout the supply chain have made necessary the creation of standard dimensions for pallets. If every manufacturer or transportation agent would create and use its own dimensions, there would be significant costs added to the logistics operations; costs that at the end would be transferred to the final customer as higher product prices. Standard dimensions also facilitate the mass-production of pallet parts, reducing their unit cost.

There are a variety of pallet sizes, depending on their major use and the geographic region where they are manufactured or used. Some of the most common sizes used in the U.S. according to the American National Standard/ MH1 (2005) are listed in the Table 1 below:

Table 1. Pallet Dimensions (American National Standard/ MH1, 2005).

Common use Pallet Size (in.) Share of annual production (%)
Grocery 48×40 30.0
Chemical 42×42 5.7
Military 40×48 4.0
Beverage 36×36 3.0
Source: American National Standard/ MH1, 2005
 

Employment in the Wood Pallet Sector

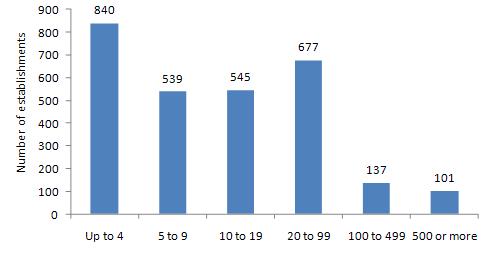
Pallet and containers manufacturers are rather small, with more than two thirds of establishments having less than twenty employees. A typical firm in this sector has only one establishment. Figure 1 shows the employment characteristics of pallet and container firms.

Figure 1. Employees per Establishment in 2006 (Census Bureau, 2010)


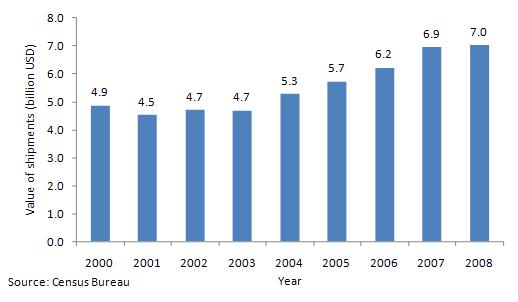
Lastly, the economic significance can also be understood by looking at the value of shipments in the U.S. As can be seen in Figure 1, value of shipments has increased almost 45 percent over the period shown (2000-2008), or at an annual growth of 5 percent.


Figure 2. Value of Shipments

References:

White, M. S., & Hamner, P. (2005). Pallets Move The World: The Case for Developing System-Based Designs for Unit Loads. Forest Products Journal, 55(3), 1-9.

Kator, C. (2008). Pallet basics. Modern Materials Handling. (Warehousing Management, Edition). Vol. 63, Iss. 5; pg. 28, 1 pgs, 2010.

MH1 Committee. (2005). American National Standard.

U.S. Census Bureau. (2009). Annual Survey of Manufacturers – Wood Pallet and Container Value of Shipments, Years 2000 to 2008. Retrieved January 2010, from Department of Commerce – Census Bureau:

http://factfinder.census.gov/servlet/DatasetMainPageServlet?_lang=en&_ts=282740229125&_ds_name=AM0531VS101&_program=EAS

U.S. Census Bureau. (2010). Annual Survey of Manufacturers – Manufacturing (Employment), Years 2000 to 2008. Retrieved January 2010, from Department of Commerce – Census Bureau: http://www.census.gov/econ/manufacturing.html

Quesada’s research group attended 64th Forest Products Society International Convention

    Article published in Newsletter InsideVT Wood 5(6). See complete newsletter here

    Drs. Henry Quesada and Tom Hammett lead the Virginia Tech delegation to the 64th Forest Products Society Annual International Convention (IC) in Madison ,Wisconsin, during June, 2010. This year’s IC saw nearly four hundred participants –an increase over recent year’s attendance, in spite of the poor economy. Dr. Quesada’s research group presented four papers and two posters and chaired a session. Dr. Hammett presented two papers, one with his former PhD student, Richard Bonsi, and displayed two posters. Tom was also an invited participant in a strategic planning “listening session” held just prior to the beginning of the IC. The FPS is conducting a year-long effort to re-position itself so that it is more responsive the needs of its members and clients. Tom joined 25 other key stakeholders including present and former board members to help gather information and start a list of priorities that will help chart new directions for FPS.

    Graduate student Scott Lyon examining one of the posters presented by Virginia Tech personnel at the FPS 64thIC.
    In addition to Henry and Tom’s participation at the annual convention, several graduate students also attended. Scott Lyon and Johanna Madrigal presented papers, and Amy Jahnke, Wang Chao, and Scarlett Sanchez displayed posters on their research. Also Post-Doctoral Associate Gi Young Jeong presented two papers. There were several positive comments, especially from some of the foreign participants (from over thirty countries!), who especially appreciated the high quality of the technical presentations.