RESEARCH BRIEF: Innovation Metrics in the Public and Private Sector: a Quick Review

By Johanna Madrigal, Phd Candidate
Virginia Tech
Email: jmadriga@vt.edu


Measuring innovation is a very complex process (Secretary of Commerce, 2007) for the private and public sectors. The Oslo Manual (OECD 2002 and 2005) suggests a methodology to measure innovation based on two sets of guidelines to define what activities belong to innovation processes and how to measure them. The first set of guidelines proposes that innovation activities should be previously segregated in three large groups in order to be measured:

  • Research and Development (R&D) activities,
  • process and product innovation activities; these activities include, but not limited to acquisition of external knowledge, machinery, equipment and other capital goods, and other preparation activities, and
  • preparation for marketing and organizational innovation, covering all activities related to organization innovation other than R&D, such as, training, activities related to development and planning of new marketing methods and marketing instruments and the design of form and appearance of products (OECD, 2005).

The second set of guidelines is known as the Frascatti Manual (OECD, 2002) gives guidance on how to collect relevant data related to R&D activities, which are complemented by economic indicators developed by countries.

Now days, the United States government measures innovation activities based on data collected from two main reports developed by the Organization for Economic Cooperation and Development (OECD). These reports are:

  • the Science and Engineering Report which records the national volume of science and technology. Main indicators obtained from this set of data are the current status of R&D as a share of GDP and the R&D expenses per type or research; and
  • (2) the Business R&D and innovation survey that collects the data relevant to Research and Development in the industry, where the main indicator reflects the expenditure in R&D made by different business sectors and the ratio of R&D to sector sales.

These two reports have helped to develop economic indicators such as R&D expenditure as a share of the GDP, R&D expenditure per type of expenditure and the amount of patent and scientific and research article generated among others.

At the industry level, literature research about innovation measurement suggest that there is no standardize method to define innovation metrics, however, there is a clear agreement about the importance to measure innovation to show firms’s growth (Anthony et all 2007, Kuczmarski 2001, Muller et all, 2005). Managers around the world recognize that measuring innovation will help to make informed decisions based on real data and, also, will help on the strategies and action plans alignment for successful results (Muller et all, 2005).

There are numerous authors who recommended several innovation metrics inside companies, such as Anthony et all (2007) who suggested a mix of metrics divided in three phases:

  • In-put related measures
  • process and oversight metrics; and
  • output related metrics.

Also, McKinsey Global Surveys (2008) found out that business organizations are interested in using metrics across the whole innovation process, such as the number or people dedicated to innovation, the amount of new ideas from outside the company, the accomplishment of time schedule, financial returns from innovation, and customer service. In addition to the previous proposed innovation measurements for business organizations, the Boston Consulting Group (BCG 2008) also performed a study that found out metrics for four main factors. (1) start-up costs, (2) speed, (3) scale and (4) support costs

In summary, data available for further analysis about innovation at the industry level is quite limited (Secretary of Commerce, 2007), and mainly relies in the data collected by the U.S. government through the economic indicators as previously cited, and data collected by private organizations, such as McKinsey Global Surveys (2008), BCG (2008) and BCG (2009). Some of the metrics identify by these organizations are shown in Table 1.

Table 1. Innovation metrics (Adapted from BCG 2009)

Innovation phases
Metrics Inputs Processes Outputs
Number of new ideas

Business-unit investment by type of innovation

R&D ratio to company sales

Full time innovation technical staff

Idea generation time

Decision to launch time

Projects by type and launch date

Projects NPV

Patents granted

Launches by business area

Percentages of sales and growth from innovation projects

Innovation ROI

With this quick review, the author aims to summarize findings from the literature to give a general overview about innovation measures at the public and private sectors. However the innovation process is rather dynamic as new metrics and measuring tools are continuously being developed.

References

Anthony, S., Fransblow, S., and Wunker, S. (2007). Measuring the black box. CEO Magazine. December (2007), 48-51.

BCG (2008). Measuring Innovation 2008. Squandered Opportunities. Massachusetts: US. Boston Consulting Group, Inc.

BCG (2009). Measuring Innovation 2009. The need for action. Massachusetts: US. Boston Consulting Group, Inc.

Kuczmarski, T. (2000). Measuring your return on innovation. Marketing Management. 9 (1), 24-32

McKinsey Global Surveys. (2008). Assessing innovation metrics. New York: US. McKinsey and Company.

Muller,A., Välikangas, L. and Merlin, P. (2005). Metrics for innovation. Guidelines for developing a customized suite of innovation metrics. Strategy and leadership. 33 (1)

OECD. (2002). Fascati Manual. Proposed standard practice for surveys on research and experimental development. Paris:France. OECD Publication Service.

OECD. (2005). Oslo Manual, the measurement of scientific and technological innovations. Paris:France. OECD Publication Service.

Secretary of Commerce. (2007). Innovation measurement: tracking the state of innovation in the American Economy. Washington, DC: US. US Department of Commerce.

WORKSHOP: Innovation Based Manufacturing

Presented by the Institute of Critical Technologies and Applied Science (ICTAS) at Virginia Tech

Workshop Description:

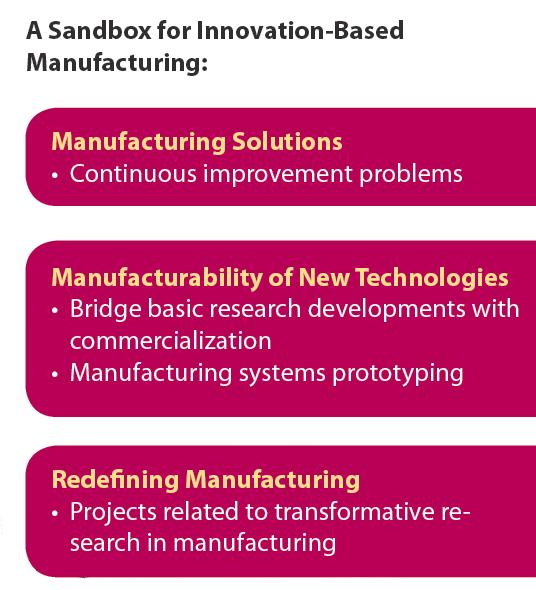
The Oslo Manual defines innovation as “is the implementation of a new or significantly improved product (good or service), or process, a new marketing method, or a new organizational method in business practices, workplace organization or external relations.” This definition makes clear that innovation is not just the creation of a new product but also the strategic improvement of internal processeses such as manufacturing. This workshop will give you an understanding of why innovation based manufacturing is critical to achieve economic development and how it can be pursued.

The morning session of the workshop will expose participants the basic concepts of innovation based manufacturing and how current developments in policy, economic development, and open innovation relate to the practice of innovation in manufacturing. The afternoon session will focus on innovation tools and how these tools can be used to developed innovative manufacturing solutions.

The workshop will also serve as the presentation of the recently established Center for Innovation Based Manufacturing (CIbM) at Virginia Tech.

Workshop Outline (subject to changes):

  • Opening remarks. Dr. Jaime Camelio, Director of CIbM at Virginia Tech. 8:30 am-8:45 am
  • Innovation Based Manufacturing. Dr. Roop Majahan, Director of ICTAS at VA Tech. 8:45 am-9:15 am
  • Innovation Policy. Dr. Julia Lane, National Science Foundation. 9:15 am- 9:45 am
  • Break. 9:45 am-10:05 am
  • Innovation and Economic Development. Dr. Darrene Hackler. 10:05 am-10:45 am
  • Innovation practices in Action. Dr. Antje Lembcke. Director Gas Turbine Engineering at Siemens. 10:45 am-11:20 am
  • Panel discussion. Dr. Jaime Camelio, Director of CIbM at Virginia Tech. 11:20 am-12:00 pm
  • Lunch. 12:00 pm-1:00 pm
  • Innovation Lab, Part 1. Dr. Jose M. Vicente-Gomila. Polytechnic Institute of Valencia. 1:00 pm-2:30 pm
  • Break. 2:30 pm-2:50 pm
  • Innovation Lab, Part 2. Dr. Jose M. Vicente-Gomila. Polytechnic Institute of Valencia. 2:50 pm-4:00 pm
  • Adjourn. Dr. Jaime Camelio. 4:00 pm-4:10 pm.

Workshop Objectives:

  • Understand the basics of innovation based manufacturing
  • Comprehend how innovation policy plays a key role in economic development
  • Understand the impact of open innovation in manufacturing solutions
  • Recognize the main aspects of embedding innovation into an organization’s structure
  • Learn innovation tools to support manufacturing solutions

Who Should Attend:

  • Anyone who would like to learn about the innovation process and how to use it to increase business competitiveness and achieve long term sustainability.
  • Entrepreneurs, Investors, Policy Makers, Process and Products Engineers, Plant Managers, Process Improvement Managers, Marketing Managers, General Managers, and Financial Managers.

Location, Date and Registration:

  • Date: November 11, 2010
  • Time: 8:30 a.m. to 4:10 p.m.
  • Location: The Inn at Virginia Tech, Blacksburg, VA
  • Investment: $125. Includes coffee breaks, lunch and workshop materials

Registration:

  • $125. Please go to http://www.cpe.vt.edu/reg/ibmw/ for online registration. If you wish to pay by check, please let us know to send you a registration form.

Further Information:

Please visit our web page at http://www.cibm.ise.vt.edu/ for more information on the CIbM. Contact Dr. Henry Quesada at quesada@vt.edu or at (540)231-0978 if you have any questions about the workshop.

RESEARCH BRIEF: The Forest Products Industry of the Appalachian Region

by Scott Lyon, MS Candidate
Virginia Tech

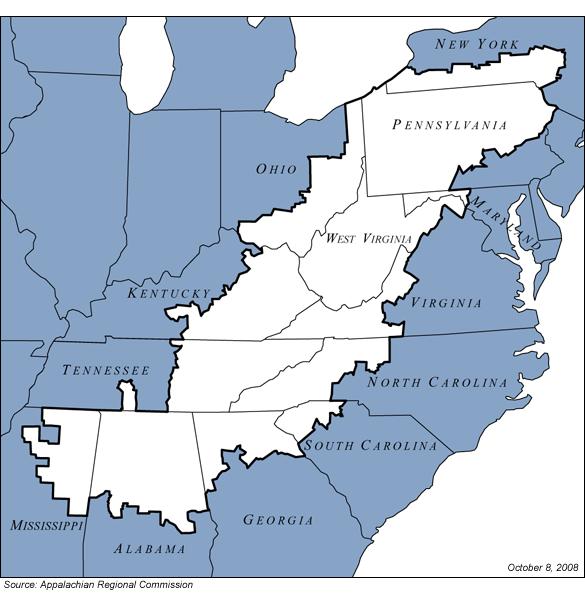
The Appalachian region consists of 205,000 square miles from southern New York to northern Mississippi, also including Pennsylvania, Ohio, Maryland, West Virginia, Virginia, North Carolina, South Carolina, Tennessee, Kentucky, Georgia, and Alabama (Figure 1; Appalachian Regional Commission 2010).  The economy in this region was fueled historically by forestry, mining, farming and industry and currently, the region is primarily involved in a mix of manufacturing and service industries (Appalachian Regional Commission 2010). Because of diversifying the economy, the amount of distressed counties in the region has been reduced from 223 in 1965 to 82 counties in 2010 (Appalachian Regional Commission 2010).

Figure 1. Appalachian Region Map (ARC 2010)

The manufacturing of forest products in this region is an essential sector of the economy employing over 1.1 million people (Murphy et al. 2008; NC-IOF & NCFA 2003; NESFA 2001; SCFC 2006; Ammerman Unknown Date; PFPA 2005; Young et al. 2007; VDACS 2008; Childs 2005; EDPA 2010; Ervin et al. 1994, McClure 2008, Mississippi State University 2010).  An increase in global competition has caused the decrease of domestic markets for U.S. furniture and this increase of competition has taken a toll on the Appalachian hardwood lumber industry (Bowe et al. 2001). The forest products industry in the Appalachian region must be innovative in their marketing strategies to find potential markets for their products (Naka et al. 2009). Other factors affecting the forest products industry has been urbanization, land development and population growth that have decreased the amount of timber available to the forest products industry (Young et al. 2007). 

 The hardwood industry in Pennsylvania is the top producer of hardwood lumber in the country manufacturing 10% of the total production in the United States (PFPA 2005; Smith et al 2003). Alabama ranks number two in timberland resources with 23 million acres of forestland fueling 850 forest product mills (EDPA 2010).  Hardwood lumber mills range in size from producing 1 million board feet (MMBF) to over 40 MMBF a year (Smith et al 2004). Some Appalachian mills have increased the amount of value-added products/processes available to customers in order to increase market size and sales. These value-added processes include: kiln drying, custom sorting/grading, S4S, finger jointing, and dimension manufacturing (Smith et al. 2004).  Low grade sawlogs and small-diameter logs were not used traditionally in lumber production in the Appalachian region.  The introduction of oriented strandboard mills (OSB), parallel-strand lumber mills (PSL) and rotary-cut plywood mills have allowed the forest product industry to expand the use of low grade raw material and make it value-added product (Luppold et al. 1998).    

The forests in this region grow a large variety of hardwood and softwood timber species that are harvested for wide assortment of forest products (VDACS 2008).  A variety of hardwood timber species primarily grow in the Appalachian region (Table 1). These species are used in many different end-use applications including: pallets, furniture, flooring, cabinets and millwork (Adams 2002; Virginia Department of Forestry 2007). 

Table 1. Hardwood Species Grown in the Appalachian Region (Adams 2002, VDOF) 

Common Name Scientific Name
red oak Quercus rubra & Quercus falcate
white oak Quercus alba
hard maple Acer saccharum
soft maple Acer rubrum & Acer saccharinum
black walnut Juglans nigra
yellow-poplar Liriodendron tulipifera
black cherry Prunus serotina
American basswood Tilia americana

Softwood lumber species grown in this region include: Eastern white pine (Pinus strobus), and Southern Yellow Pine (Pinus palustris, P. elliotii, P. taeda, P. echinata).  These softwood species are primarily used as lumber for construction applications, furniture, cabinets, and other interior uses (Virginia Department of Forestry 2007). 

Not only does the forest have a significant impact on the region’s economy but it also helps control water and air quality creating benefits the local communities (Childs 2005; Virginia Department of Forestry 2007). Components of the forest ecosystem work together to reduce the amount of storm water runoff entering nearby watersheds.  In urban areas, forests help lower the amount of runoff by collecting it in leaves, branches and soils (American Forests Unknown Date).  Forests produce organic compounds that reduce the amount of air pollution in an area.  A study in Chicago, Illinois, found that urban trees helped decreased the amount of toxic emissions in the air surrounding the city (Nowak 1994). The Appalachian forests provide a variety of benefits to both humans and the environment.  The forest products industry provides to local economies with added jobs and revenues.  The forests also provide a renewable resource that can be sustainably harvested.

References:

Please email Scott Lyong at swlyon@vt.edu to request the list of references.