
By Joseph Pomponi. Email: jpp5251@vt.edu
The methodology of the survey followed the procedures listed. There were 2 waves of surveys that were mailed; 500 companies per state involved in the study for a total of 3,000 copies of the survey. An online version was available as well. The survey questions were divided into specific sections: business information, wood materials used in the company, wood products supplier selection, and wood products supplier evaluation. Companies were randomly drawn from a 3rd party website generating SIC codes based upon the following categories: general contractors, home builders, construction companies, building contractors, and home improvements. The 1st wave was sent out the week of March 2nd, 2020 then a reminder to fill out the survey was sent out the week of April 1st, 2020. Due to COVID-19, a decision was made to wait to send out the second wave of surveys until the week of May 25th, 2020 since it was not known if companies were doing business during that time period. The survey was closed July 6th, 2020 and no further responses were recorded. 59 responses were received over the course of the 2 waves of surveys and the online version. There was an issue of nonresponse bias due to lower response rate, however since the 2nd wave had similar numbers of responses to the 1st wave, it can be inferred the 2nd wave is representative of the population. Due to this low response rate, phone calls were made to companies based off of the list of companies generated from the 3rd party website. 46 companies were contacted for a total of 105 responses combined with the survey. Selected questions were asked from the survey on the phone calls to gain further information. Results from the combined phone call and survey responses were analyzed.
The results gathered from the survey mainly lined up to what was seen in literature. Many of the companies responding had 1-50 employees indicating that they were not a big company. Also, many companies responded that they worked more on single-family projects as opposed to multi-family and commercial projects; the number of projects most companies reported they worked on was less than 5. Most companies do not work in multiple states, and a lot of them responded that they weren’t aware if the products they purchased were manufactured in their own state, as well as not knowing if they purchased in-state.
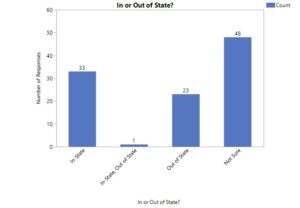
Figure 1. Number of Responses for if the Company Mainly Purchased in or out of State
The majority of the responses indicated that the company was not sure where they purchased their wood products. This indicated that there was a lack of knowledge regarding where the majority of wood products came from. While there were a decent number of responses regarding in-state purchases, the out of state purchases combined with the unknowns meant that the majority of companies were unsure of where their products came from or just outsourced their purchases. The issue is the fact that construction companies could purchase from a location that is closer to them, thus reducing costs such as transportation and handling costs so they could improve their bottom line, but if the companies did not know where their products came from, then it would be hard to reduce these costs.
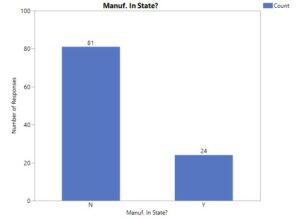
Figure 2. Number of Responses for if the Company is Aware if the Products they Purchased are Manufactured In-State
There is a difference between knowing if a product is manufactured within the state and knowing if the product was purchased within the state. However, companies were also not aware if the products they purchased were manufactured within their own state. The results show the need of knowledge of where wood products are coming from as well as where products are purchased in order for local supplier to have an impact in the market.
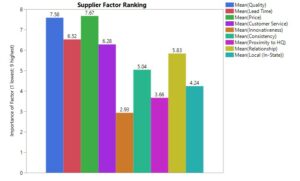
Figure 3. Means of Supplier Factor Ranking (1 Lowest; 9 Highest)
The factors listed in figure 3 were asked to be ranked from 1 to 9 in terms of importance to the company with 1 being the lowest priority factor and 9 being the highest priority factor. The most important factors were: price, quality, lead time, and customer service. Relationship was another important factor but it wasn’t as important as the other factors listed. These were the things that construction companies were looking for in their suppliers. The top factors were also seen in literature often. While it would be hard for suppliers to focus on all of these factors, they could differentiate themselves using 1 or 2 factors in order to appeal more to the construction company. For example: a supplier could have a very high-quality product that has a lead time that is flexible with the construction company, this would probably be at a higher cost than other products but it would be worth that cost to the company if it arrives on their schedule and is a good product. It would be better for suppliers to focus their efforts on improving 1 or 2 of these factors, so that their products and services could appeal to more construction companies.