
By Sevtap Erdogan, Email: serdogan@vt.edu
While other industries have been using Statistical Process Control (SPC) to control quality for decades, the wood products industry has been relatively late in adopting SPC. It was not until the 1980s decade when wood products companies began to use SPC practices as a way to address quality concerns after a renewed focus on quality by American consumers (Young and Winistorfer, 1999). Within the wood products industry, statistics have especially been under-used as a way to control quality in hardwood lumber products. However, the decreasing supply of timber, and therefore rising product costs, may cause more wood products companies to reconsider the use of SPC (ibid.). Statistical Process Control is a method to incorporate continuous statistical analyses during production in order to improve quality. Young and Winistorfer (1999, p. 11) define SPC as using statistics “to achieve and maintain control of process and production within a repetitive manufacturing process.” In addition, Srinivasu, Reddy, and Rikkula, (2009, p. 15) note that SPC aims to “control quality characteristics on the methods, machine, products, [and] equipments both for the company and operators.”
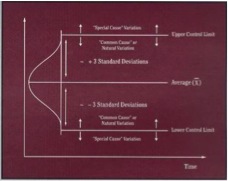
Quality control charts are primarily done through identifying and minimizing of variation. When the process is out of control, the sources of variation need to be identified and eliminated. These systematic issues could arise from issues with raw materials, equipment, or operating procedures (Srinivasu et al., 2009; Young and Winistorfer, 1999). Only random variations are allowed as a result of the natural variation of the process. Figure 1 provides a basic example of a control chart used to identify variations in product quality
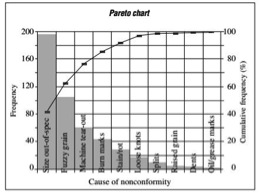
In order to minimize variability, companies have incorporated Pareto analyses as part of their SPC initiatives (Leavengood and Reeb, 2002; Young and Winistorfer, 1999). Pareto analyses are based on the principle that approximately 80 percent of problems are caused by 20 percent of the possible causes (ibid.). Therefore, SPC and Pareto analyses can help prioritize quality problems for a company to address and to focus on the “vital few” problems instead of the “trivial many” (Leavengood and Reeb, 2002, p. 2). In order to adopt Pareto analyses. Several steps can help ensure the effectiveness of Pareto analysis in SPC. First, companies should develop a standardized list of criteria to identify what can be identified as a “nonconformity”, and then provide a clear definition of the criteria and a definition of the nonconformity (Leavengood and Reeb, 2002). Next, companies should develop a standardized way of categorizing these nonconformities. Within the context of the wood products industry, for example, “one person may call an item with torn grain a machining defect, another might call it fuzzy grain, and another may call it reaction wood” (ibid., p. 3). Once company staff have collected data on a number of nonconformity issues, Pareto analyses require that the frequency of these issues is charted for each category of nonconformities after sorting nonconformities from highest to lowest frequency and determine the relative frequency for each (Leavengood and Reeb, 2002). Figure 2 provides an example of what one of these charts may look like. In addition to generating and analyzing control charts based on continuous variables, attribute control charts can help control the production process of a company when measurements such as good or bad, accept or reject, go/no-go, or pass or fail criteria are used.
For the implementation of these SPC practices to be effective, SPC is meant to include several continuous improvement principles. SPC first applies continuous improvement principles by having measurements taken continuously and through all steps of the production process (Young and Winistorfer, 1999). This allows for problems to be detected early on, which can save costs compared with only identifying a flaw after the completion of the production process. In addition, Young and Winistorfer (1999) state that for SPC to be effective companies should incorporate continuous improvement principles such as having staff from all levels of a company (operators, operator assistants, supervisors, and top management) involved in the decision making process. The authors also suggest that companies continuously reward and acknowledgement of employees and tie these rewards and acknowledgements to the results of SPC.
By using the discussed strategies, wood products companies can incorporate statistical analyses in identifying product errors and in improving quality. Implementing SPC in a process that incorporates continuous improvement principles can allow the quality of wood products to meet the needs and desires of customers. It can also save costs for a company throughout the production process.
References:
- Leavengood, S. A., & Reeb, J. E. (2002). Statistical process control part 3: pareto analysis and check sheets. Corvallis, Or.: Extension Service, Oregon State University.
- Maness, T. C., Kozak, R. A., & Staudhammer, C. (2003). Applying Real-Time Statistical Process Control to Manufacturing Processes Exhibiting Between and Within Part Size Variability in the Wood Products Industry. Quality Engineering, 16(1), 113-125.
- Srinivasu, R., Reddy, G. S., & Rikkula, S. R. (2009). Utility of quality control tools and statistical process control to improve the productivity and quality in an industry. International Journal of Reviews in Computing, 2, 15-21.
- Young, T. M., & Winistorfer, P. M. (1999). Statistical process control and the forest products industry. Forest products journal, 49(3), 10-17.