RESEARCH BRIEF: Engineering Change Orders (ECOs), an important engineering performance indicator

By Chao Wang, MS Candidate
Department of Wood Science and Forest Products
Virginia Tech

What are Engineering Change Orders (ECOs)?

ECOs are also called Engineering Change Notices (ECNs) or just Engineering Changes (ECs). ECOs are a significant driver of product development costs and lead time (Loch and Terwiesch 1999). Engineering changes (ECOs) refers to making design changes to an existing product (Barzizza, Caridi, and Cigolini 2001). It includes changes for improving production efficiency as well as the changes for assuring product quality and performance (Balakrishnan and Chakravarty 1996).

Types of ECOs

(Barzizza, Caridi, and Cigolini 2001) categorized ECOs as “scrap”, ”rework”, and ”use-as-is”. “scrap” means serious technical faults and user safety problem and needs to be solved immediately. “Scrap” will directly affect the work in progress (WIP) inventory since all these inventory cannot be applied to other products. ”Rework” means ECOs are required for improvements of pre-change WIP without affecting finished products and components. ”Use-as-is” means a product has no technical faults and user safety problem but need to improve product design.

Engineering Performance of Furniture Industry

Figure 1. Causes of Engineering Errors

ECOs are also one of the reflections of engineering performance in the furniture industry. According to our interview, furniture engineers spend over 50% of their available engineering time on issuing ECOs for late design changes and architecture modifications. ECOs could be classified as ECOs for engineering errors and ECOs for engineering improvements. Less engineering errors could not only ensure product quality, but also could shorten the time-to-market and reduce the production cost. In order to find what are the most frequently occurred errors, a Pareto analysis could help us to have an idea on what the major contributors are. Figure 1 showed a Pareto Analysis of the engineering performance of a solid wood furniture company. The ECOs data represents a single month in that company. The number of ECOs issued for correcting engineering errors accounted for 98.67% of all the ECOS issued during this month. The rest 1.33% were ECOs for product improvements. From Figure 1, we could observe that “drawing error”, “part dimension error” and “wrong selection of hardware” take over 80 percent of the total engineering errors (most critical ones according to Paretto Analysis). Specifically, “drawing error” accounts for 44% of all the errors. Followings are” part Dimension Error” which accounted for 32%, “Wrong selection of hardware” accounted for 10%, “Hardware missing” accounted for 9%, “Wrong numbers of hardware” accounted for 3%, “Dimension missing” and “Missing drawings” both accounted for 1%.

Knowing what are the major causes of engineering error is important because ECOs (for correcting the engineering errors) are a type of waste which requires a lot of rework and iteration period. The Pareto Analysis can help us to find the major causes, and then we could try to find effective methods to eliminate these wastes.

Reference:

  • Balakrishnan, N., and A. K Chakravarty. 1996. Managing engineering change: Market opportunities and manfucturing costs. Production and Operations Management 5, no. 4.
  • Barzizza, R., M. Caridi, and R. Cigolini. 2001. Engineering change: a theoretical assessment and a case study. Production Planning & Control 12, no. 7: 717–726.
  • Loch, C. H, and C. Terwiesch. 1999. Accelerating the process of engineering change orders: capacity and congestion effects. Journal of Product Innovation Management 16, no. 2: 145–159.

RESEARCH BRIEF: Statistics for the Pallet Industry sector in US

By Leslie Scarlett Sanchez, MS Candidate
Department of Wood Science and Forest Products
Virginia Tech
 

Pallets

Pallets are the interface between packaging and the unit load handling equipment (White & Hamner, 2005). Another simpler definition is that pallets are “portable platforms”, which facilitates the movement and storage of unitized goods (Kator, 2008).

Unit loads are also important to define, as the system comprised of pallets, packaging materials, and unit load stabilizers (stretch wrap, tie sheets, corner posts, load adhesives, and strapping).

Pallet Sizes

The growth of domestic and international trade, the need to plan operations for the transportation, warehousing, and handling of materials throughout the supply chain have made necessary the creation of standard dimensions for pallets. If every manufacturer or transportation agent would create and use its own dimensions, there would be significant costs added to the logistics operations; costs that at the end would be transferred to the final customer as higher product prices. Standard dimensions also facilitate the mass-production of pallet parts, reducing their unit cost.

There are a variety of pallet sizes, depending on their major use and the geographic region where they are manufactured or used. Some of the most common sizes used in the U.S. according to the American National Standard/ MH1 (2005) are listed in the Table 1 below:

Table 1. Pallet Dimensions (American National Standard/ MH1, 2005).

Common use Pallet Size (in.) Share of annual production (%)
Grocery 48×40 30.0
Chemical 42×42 5.7
Military 40×48 4.0
Beverage 36×36 3.0
Source: American National Standard/ MH1, 2005
 

Employment in the Wood Pallet Sector

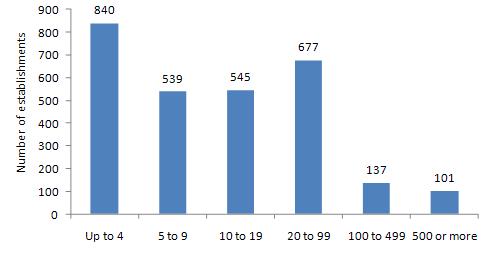
Pallet and containers manufacturers are rather small, with more than two thirds of establishments having less than twenty employees. A typical firm in this sector has only one establishment. Figure 1 shows the employment characteristics of pallet and container firms.

Figure 1. Employees per Establishment in 2006 (Census Bureau, 2010)


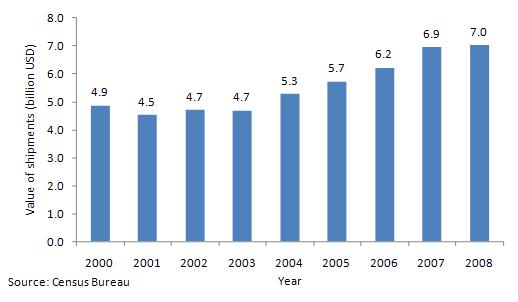
Lastly, the economic significance can also be understood by looking at the value of shipments in the U.S. As can be seen in Figure 1, value of shipments has increased almost 45 percent over the period shown (2000-2008), or at an annual growth of 5 percent.


Figure 2. Value of Shipments

References:

White, M. S., & Hamner, P. (2005). Pallets Move The World: The Case for Developing System-Based Designs for Unit Loads. Forest Products Journal, 55(3), 1-9.

Kator, C. (2008). Pallet basics. Modern Materials Handling. (Warehousing Management, Edition). Vol. 63, Iss. 5; pg. 28, 1 pgs, 2010.

MH1 Committee. (2005). American National Standard.

U.S. Census Bureau. (2009). Annual Survey of Manufacturers – Wood Pallet and Container Value of Shipments, Years 2000 to 2008. Retrieved January 2010, from Department of Commerce – Census Bureau:

http://factfinder.census.gov/servlet/DatasetMainPageServlet?_lang=en&_ts=282740229125&_ds_name=AM0531VS101&_program=EAS

U.S. Census Bureau. (2010). Annual Survey of Manufacturers – Manufacturing (Employment), Years 2000 to 2008. Retrieved January 2010, from Department of Commerce – Census Bureau: http://www.census.gov/econ/manufacturing.html

Quesada’s research group attended 64th Forest Products Society International Convention

    Article published in Newsletter InsideVT Wood 5(6). See complete newsletter here

    Drs. Henry Quesada and Tom Hammett lead the Virginia Tech delegation to the 64th Forest Products Society Annual International Convention (IC) in Madison ,Wisconsin, during June, 2010. This year’s IC saw nearly four hundred participants –an increase over recent year’s attendance, in spite of the poor economy. Dr. Quesada’s research group presented four papers and two posters and chaired a session. Dr. Hammett presented two papers, one with his former PhD student, Richard Bonsi, and displayed two posters. Tom was also an invited participant in a strategic planning “listening session” held just prior to the beginning of the IC. The FPS is conducting a year-long effort to re-position itself so that it is more responsive the needs of its members and clients. Tom joined 25 other key stakeholders including present and former board members to help gather information and start a list of priorities that will help chart new directions for FPS.

    Graduate student Scott Lyon examining one of the posters presented by Virginia Tech personnel at the FPS 64thIC.
    In addition to Henry and Tom’s participation at the annual convention, several graduate students also attended. Scott Lyon and Johanna Madrigal presented papers, and Amy Jahnke, Wang Chao, and Scarlett Sanchez displayed posters on their research. Also Post-Doctoral Associate Gi Young Jeong presented two papers. There were several positive comments, especially from some of the foreign participants (from over thirty countries!), who especially appreciated the high quality of the technical presentations.

RESEARCH BRIEF: Growth strategy opportunity for Wood Products Industry: Research and Development

by Johanna Madrigal
Ph.D. Candidate, Virginia Tech
 

The Frascati Manual indicates that Research and Development (R&D) expenditures in The United States of America (USA) are classified by the North American Industry Classification System (NAICS) and under three research categories. These three categories are: (1)Basic research that covers all the experimental and theoretical work developing knowledge for the foundation of a topic but with no defined application or use; (2) Applied research which is knowledge developed through original investigation aiming an objective; and (3) Experimental development that is created under a systematic work, developing knowledge or using existing knowledge, targeting improvement of current material, products, process and services or the development new materials, products, processes and services. In 2008, R&D expenditures in the USA were approximately $397 billion. Out this total, basic research accounts for 17% ($69.15 billion), applied research for 23% ($88.59 billion), and development for about 60% ($239.89 billion)  according to the National Science Foundation (NSF 2010). 

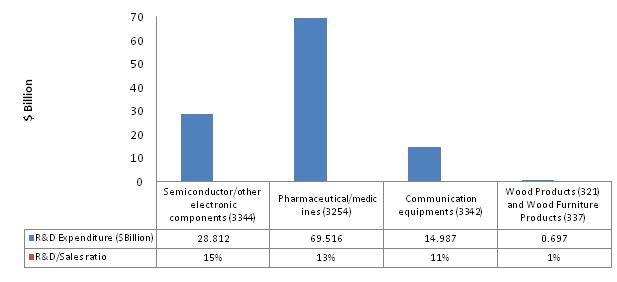
At the industry level, these expenditures were mostly performed by the pharmaceuticals/medicines (NAICS code 3254), the semiconductor/other electronic components (NAICS   code 3344),  the communications equipment (NAICS code 3342), and Software publishers  (NAICS code 5112) sectors. This last sector has the highest ratio of R&D as a share of sales.   Table 1 shows the data corresponding to R&D expenses and sales for these industries (Wolfe, 2010). 

Table 1. R&D expenses as a share of sales. (Wolfe, 2010)

Industry (NAICS code) Sales worldwide ($ million) R&D expenditure ($ million) R&D as a share of sales
Semiconductor/other electronic components (3344) 192,258 28,812 15%
Pharmaceutical/medicines (3254) 529,601 69,516 13%
Communication equipments (3342) 132,307 14,987 11%
Software publishers (5112) 317,084 35070 11%

In the wood products industry data show that the primary wood products (NAICS code 321) and the secondary wood products sector (NAICS code 337) spent together $0.697 billion in 2008, which is less than 1% of total sales, similar to what happened in 2006 in this industry (Wolfe 2010). As a comparison, the overall ratio of R&D expenses to sales in the manufacturing industry in US was approximately 4% in 2006. This might be indicating that perhaps wood products industries need to increase their investments in R&D activities in order to increase their sales.  Figure 1 shows a comparative chart of R&D expenditures as a ratio of sales for some industries including wood products.

Figure 1. R&D expenditure by selected industry (Wolfe, 2010)

 This situation shown in Figure 1 might be an indication that R&D expenditures (as a measure of Innovation) must could be defined as a sustainable growth strategy for the Wood Products Industry if the business wants to remain competitive and profitable.

References:

National Science Board. (2010). Research and development: essential foundations for U.S. competitiveness in a global economy. A companion to Science and Engineering Indicators – 2008. NSF.

Wolfe, R. (2010). U.S. Businesses Report 2008 Worldwide R&D expense of $330 billion: findings from new NSF survey. NSF. 10, 322