RESEARCH BRIEF: Developing of a Lean Process Strategy for the Production of Thermally-modified wood

by Laura Cordoba, email laucordobarios@vt.edu

The wood market share includes environmentally friendly products such as thermally-modified (TM) wood. Wood products companies are working hard to create new products and to improve their production processes to satisfy their clients, meet financial goals, and to reduce their environmental footprint.

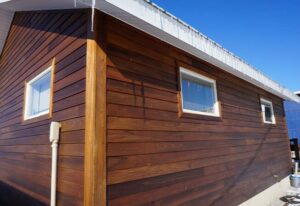
Siding: a TM wood application

Wood is commonly known for being a versatile renewable resource and in general is a non-toxic material. As a natural product, wood  must go through a value-added transformation to acquire the desired functionality. Thermal modification is a known process for this transformation, and it has been recently adopted by industries around the United States. This wood modification process is attractive for the market because creates a price competitive product, with great stability, increase decay resistance, and free of chemicals (Aro et al, 2014).

Thermally-modified (TM) wood has been available since the early 1990s in Europe, where it was developed as a substitute product to tropical hardwood lumber. TM wood is a product that is relatively new in the U.S. Therefore; consumers such as architects, engineers, building contractors, and end consumers are still hesitant about its potential and use (Wardell 2015). The fact that this kind of wood modification technique is new in the US provides chances to find improvements for the product and the process itself.

Lean thinking provides an opportunity to identify current problems that are affecting the manufacturing process of TM wood. Lean thinking is a business model that help managers to identify waste in the value stream of manufacturing, supply chain and services processes. Besides the presence of waste, long lead times, and high manufacturing costs are also part of the main concerns present in the manufacturing of TM wood. These issues could make a negative impact on the efficiency and effectiveness of the manufacturing process.

The first activity in the implementation of Lean Thinking in the production TM wood is to understand the production process. A mapping of the process is the first step following by the developing of efficiency and effectiveness metrics such as production rates, inventory levels, production costs, and lead times metrics. The second activity is to identify improvement opportunities and non-value activities on the manufacturing process of TM wood. The final activity is to design an improved production process that can help to solve the current issues. Lean thinking offers a variety of tools such as visual control, standardization of procedures, 5S, and plant layout that can be used to solve the issues and improve the current process.

A project like this requires to set up meetings, interviews, and walk-throughs to be able to map and obtain the required performance metrics to understand the current state of the process. Analysis of production data is also critical. The mapping of the process is conducted through value stream map (VSM). An Ishikawa diagram is also used to help understand the causes for the current issues. The future state or solution is also displayed on a new VMS culled the future VSM. In addition and economic analysis is conducted to tie the potential solutions to financial aspects.

References

  • Aro, M., Bradshaw, B., and Donahue, P. 2014. Mechanical and Physical Properties of Thermally Modified Plywood and Oriented Strand Board Panels. Forest Products Journal. 64(7/8):281-289.
  • Wardell, C. 2015. Thermally modified decking. Professional Deck Builder. June. pp:42-44


RESEARCH BRIEF: Yellow Poplar for CLT manufacturing

by Sailesh Adhikari, email Sailesh@vt.edu

In North America, the structural use of the lumber is conventionally dominated by softwood species. In the past, hardwood species was studied for dimensional grading when grading techniques for structural timber has been implemented (Ding, 1987).  However, due to low economic advantages, hardwoods have never been successfully manufactured as structural lumber (Grasser, 2015) and left behind with traditional sawing practice of random length and width.  AHEC (2008) argued that because of low economic margin and sufficient availability of the softwood lumber and their mechanical properties to meet the design requirements, hardwood lumbers are never considered to standardize and continue to produce in random width and random length.  Though there has been some effort to use hardwood lumbers in dimensional construction.

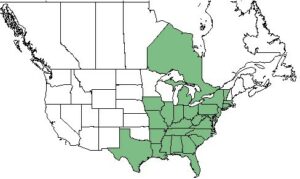
Figure 1: Geographic range of yellow poplar in North America (USDA, 2015).

The first hardwood species which occasionally appeared on the structural market is yellow poplar (YP) (Green, 2005) because of some intrinsic properties of YP wood. Additionally, YP lumber is considered as easy to machine and plane which dry in faster pace compared to other hardwood species. Also, HMS (2013) reported that YP had shown stable connection and high quality finishing properties, that makes it more attractive for CLT application.

North American CLT standard and YP

CLT manufacturing with YP lumber is generally feasible as research and pilot projects have already proven (Slavid, 2013, Beagley et al., 2014; Espinoza et al., 2016). Given the intrinsic wood properties and existing ANSI/APA standard YP exhibits the properties to be considered as CLT raw material. The YP lumber properties and ANSI/APA standard are compared in Table 1.

Table 1: General requirements of North American CLT standards and Yellow- poplar lumber.

Requirements Standard YP Source
Recognized by the ALSC under PS 20 No (ALSC, 2010, ANSI/APA, 2012)
Specific Gravity, (0.42)  above 0.35 Yes (Bendtsen and  Ethington, 1975, ANSI/APA, 2012)
Minimum lamination grade major strength direction: 1200f-1.2E MSR; Visual No. 2 Yes (AWC, 2014, ANSI/APA, 2012)
Minimum lamination grade minor strength direction: Visual No.3 Yes (AWC, 2014, ANSI/APA, 2012)
CLT Grade for YP No (ANSI/APA, 2012)

Potential of YP lumber in CLT

Research conducted in Virginia Tech to utilize YP lumber in CLTs produce significantly positive results on the mechanical test.   Six 5-layer CLT beams (101” x 6” x 3.13”) have been fabricated and were tested non-destructively to complete this study.  The observed result concludes that the YP CLT is capable of matching strength requirements on effective bending stiffness (EIeff) and effective shear stiffness (GAeff) of the current North American CLT standard ANSI/APA PRG 320 (Mohammad et al., 2015).  Research conducted at the University of Trento in Italy examined into strength properties for CLT concludes that YP CLT has three times more strength and stiffness under rolling shear than other softwood species that is commonly used in CLT fabrication (Slavid, 2013).  The same research also concludes that yellow-poplar lumber is an ideal raw material source for CLT manufacturing given its properties.

The first YP CLT application in structure is Maggie’s Oldham from the UK, which is the world’s first building made from hardwood cross-laminated timber (CLT). Recently College of Architecture and Urban Studies and Department of Sustainable Biomaterial work together to construct a train observatory in Radford, VA registering as the first successful hardwood CLTs in structural application in the US.

Research and pilot studies conclude that technically and performance-wise YP lumber is a possible substitute or admix to softwood lumber, but there is some significant barrier to implement YP CLTs.   Most notable of all the significant barriers to successful hardwood CLT implementation is the efficient manufacturing of hardwood lumber produced to the CLT standard. Currently, hardwood sawmills are designed for appearance grade lumber production and not for the required CLT standard. In the dimensional aspect of current hardwood lumber production Quesada (2018) and Espinoza (2016) note significant findings compare to the CLT standard ANSI/APA PRG-320 2017.

  • The thickness of CLT layers should be between 5/ 8 inches and 2 inches, so lumber from hardwood logs should be sawn to a maximum of 2 inches thick.
  • For lumber to be used in the parallel load direction, the width should be greater than 1.75 times the thickness of the lumber, which excludes 2×2,2×3 dimensions. Lumber in perpendicular layers must have a width to thickness ratio greater than 3.5, which excludes 1×2, 1×3, 2×2, and 2×4 dimensions. Thus, the minimum possible lumber dimension can be 2X6.  Hardwood logs should be sawn to the dimension of 2X4 and higher for the parallel layer application and 2X6 and higher for the perpendicular direction.
  • All lumber to be used in CLT has to be surfaced on all sides and trimmed with 2% and below dimensional tolerance(ANSI/APA,2017).

Second major limitation of hardwood CLT implementation is the raw material price (Grasser, 2015).  The average price of the random length of YP lumber in March of 2018 was about $450 (AHEC, 2018), at the same time the average price of the southern yellow pine was about $360 (Madison Report, 2018) in North America. However, if we observe further, the price of low grade YP lumber, i.e., below 2com, the average price is less than $346 (AHEC, 2018). Thus there is an excellent opportunity to utilize lower grade YP lumber for CLT application.

The potential use of the YP in CLTs is an excellent opportunity to utilize the highly growing feedstock from the Eastern region of the US. At present, YP is one of the species that have a higher growth rate than harvesting rate, despite increased harvesting from the past.  Additionally, it grows from the plain of south Texas to the northern part of Canada, as shown in Fig 1, so there is an abundant resource available for this particular market. As the production of the CLTs for structural application grow to industrial level in the US, CLT manufacturer has to depend upon the traditional dimensional lumber species to meet the demands that will trigger the increased competition and potentially increased lumber price. Thus, YP lumber can be marketed from now as the additional raw material to the CLTs market so that both CLT manufacturer, as well as lumber producer, will be benefited with additional market opportunity.

The first step to promote YP lumber in CLT application is to manufacture CLT mats because at present situation, it is the standard product of all CLT manufacturer in the US and manufacturing CLT mats does not require to meet PRG 320 standard.  Such practice will help lumber manufacturer to find a new market and evaluate the cost factor to prepare the ready to use lumber for CLT application. On the other hand, CLT manufacturer with their manufacturing experience and capacity can work to establish the standard for the YP CLTs that will be crucial to recognize hardwood CLTs for the structural application.

References

  1. AHEC 2008. Guide to American Hardwood Products. Washington: American Hardwood Export Council.
  2. ANSI/APA. 2012. ANSI/APA PRG 320-2012 Standards for performance-rated cross-laminated timber. ANSI/APA, Tacoma, Washington. 23 pp.
  3. ANSI/APA. 2017. ANSI/APA PRG 320-2012 Standards for performance-rated cross-laminated timber. ANSI/APA, Tacoma, Washington.
  4. Beagley, K. S., Loferski, J. R., Hindman, D. P. & Bouldin, J. C. 2014. Investigation of hardwood Cross Laminated Timber design. World Conference on Timber Engineering. Quebec, Canada.
  5. Denig, J., Wengert, E. M., Brisbin, R., & Schroeder, J. (1984). Dimension Lumber Grade and Yield Estimates for Yellow-Poplar. Southern Journal of Applied Forestry, 123-126.
  6. Espinoza, O., Buehlmann, U., Laguarda, M., & Trujillo, V.R., 2016. Identification of research areas to advance the adoption of cross-laminated timber in North America. Bio-Products Business, 1-13.
  7. Grasser, K.K. 2015. Development of cross-laminated timber in the United States of America. Master’s Thesis, University of Tennessee, 2015. Retrieved from http://trace.tennessee.edu/ utk_gradthes/3479.
  8. Green, D. W., 2005. Grading and properties of hardwood structural lumber. Undervalued hardwood for engineered materials and components. Madison, WI: Forest Products Society.
  9. 2013. Species Guide – Poplar [Online]. Pittsburgh: Hardwood Manufacturers Association. Available: http://www.hardwoodinfo.com/articles/view/pro/24/315
  10. Mohamadzadeh, M., & Hindman, D. (2015). Mechanical performance of yellow-poplar cross-laminated timber.
  11. Quesada, H. (2018). Potential and limitations of using hardwood lumber as raw material for CLT. PowerPoint Presentation. West Lafayette, Indiana, USA. March 21, 2018.
  12. Slavid, R., 2013. Endless Stair – A Towering Escher-like structure made from American tulipwood CLT for the London Design Festival 2013.


Is the Cross-laminated timber (CLT) market an option for the hardwood industry?


Three ply cross-laminated timber (CLT) made of Yellow Poplar

By Henry Quesada

*Articled published in the Virginia Loggers Association Newsletter in August 2018.

Cross laminated timber (CLT) has been in the market since 2000 when it was launched in Austria by a company called KHL. A CLT panel is composed of 3, 5, or 7 layers of lumber. Each layer is glued perpendicularly to each other. Today almost 100% of the CLT panels being produced are made from softwood species and it is estimated that the current CLT production in Europe is around 1 million cubic meters.

In the United States, production of CLT started about 5 years ago. There are currently three companies producing CLT panels in the USA: DR Johnson (OR), Smartlam (MT) and Sterling (IL). DR Johnson uses Douglas Fir (DF) as the main raw material while Smartlam uses Spruce-Pine-Fir (SPF) and Sterling uses Southern Yellow Pine (SYP). It has been announced that over the next two years the following 4 CLT production facilities will start production: Katerra in Washington, a second plant by Smartlam in Maine, LignaCLT Maine, and International Beams in Alabama. All of the upcoming facilities will be using softwoods as raw material.

All of the US CLT current and planned producers (except Sterling Lumber) are in compliant with the CLT standard, PRG-320. Sterling Lumber produces CLT matts for energy projects (non-structural application) so there is no need to follow the CLT standard.

The CLT standard, ANSI/APA PRG-320, does not admit hardwood lumber yet; a major hurdle for hardwood lumber to become an accepted CLT raw material. Any softwood species as described in the ALCS under PS 20 with specific gravity higher than 0.35 should be an acceptable raw material for CLT, according to ANSI/APA PRG-320. In most of the cases, hardwood species have higher specific gravity than softwood, so this should not be a problem. In addition, lumber for CLT should be dried to a moisture content (MC) of 12%+-3%. This is also not an issue for hardwood lumber as most of it is dried to 8% MC.

A key requirement for lumber going into CLT is that the minimum thickness in the PRG-320 is 5/8. As we know, most of hardwood lumber is produced in 4/4 thickness. In addition, the board width should exceed its thickness by 1.5 times (in the major strength direction of the CLT panel) and by 3.5 times in minor strength direction of the panel. Currently, most hardwood mills produce random widths that definitely need to be sorted out to comply with this requirement.

Glue-line performance should be considered too. Hardwood lumber has a more complicated cellular structure than softwood lumber that could present challenges with adhesion. For example, some hardwoods are stiffer than softwoods and this might require additional pressure or pressing time. Also, chemicals in the hardwood lumber could also prevent an optimal glue-line in- between the panels.

Machining hardwood lumber is different than softwood lumber. Because hardwoods have a different structure, there could be a need for different tooling and energy requirements. Some hardwoods present crystals and other hard structures that could wear tools faster than softwood lumber. These issues ultimately will impact cost and productivity of the planer, finger joint, and computer numerical control (CNC) equipment of the CLT production line.

There is also the question about the supply of hardwood lumber for CLT. A medium size CLT plant could process about 50,000 cubic meters per year which translate to roughly 21 million board feet. It is estimated that CLT demand in the US would be very similar to Europe or around 1 million cubic meters (424 million bf). The current structure of hardwood industry is fragmented so it would be very difficult for a major CLT plant to establish a steady and consistent supply of hardwood lumber under these market conditions.

Hardwood sawmills that wish to become suppliers of a CLT panel plant must adjust their production mix. Virginia Tech researchers conducted a mill study and determined that Yellow Poplar lumber that is NHLA graded 2 Common and lower could be sold as raw material for CLT as long as the specific species meet the technical requirements in the PRG 320 (specific gravity, Modulus of Elasticity, etc). Higher grades (1 Common and higher) should continue to be sold in the appearance market as mills can get more revenue in this market than selling it as CLT raw material. Ultimately, hardwood sawmills would need to train their personnel to grade hardwood lumber under structural grading rules.

Other issues that should be considered for hardwood CLT panels is the weight of panels. It has been estimated that hardwood CLT panels could weigh up to 30% more than softwood CLT panels. In terms of logistics and transportation arrangements, this could increase the overall cost and time of the projects as additional trips are required to move the completed hardwood CLT panels to the construction site. An alternative would be produced 3 or 5 ply softwood CLT panels and add a layer of hardwoods just to meet the weight requirement

Finally, there is also the question of sustainability. It has been confirmed by the US Forest Service that growth of hardwood forest doubles its harvesting rates. However, it should be considered that growing hardwoods might take as much as double the time of growing softwood timber. In addition, softwood timber is growing in plantations which increases the productivity of the timber.

As we just pointed out, it seems that there are opportunities for hardwood lumber to participate in the CLT market. However, there are some critical hurdles that need to be resolved before this could happen. At Virginia Tech and other universities, we continue to generate research in technical, manufacturing, and marketing aspects of the potential use of hardwood lumber in the CLT market. If you have questions, please let us know at your earliest convenience.

Efficiency and Performance measurement: Application of DEA in Forest products Industry

by Gaurav Kakkar, kakkarg@vt.edu

Forest products industry is extremely complex by nature. With an aim to develop sustainably, this mature industry have to deal with demanding and wide variety of performance measures. Thus determination of efficiency in such situations is highly difficult. But with the ever growing completion, the companies to need to be efficient in order to compete and survive even with low net profit margins (Sporcic & Landekic, 2014). In such cases where the business work in such complex environment, independent efficiency measures might become isolated approach for business assessment. Rather comparison of performance between firms operating on a similar transformation process might be more useful. This is measure of relative performance (Salehirad & Sowlati, 2006). Relative efficiency is measured by the ratio of relative efficiency of weighted sum of outputs and weighted sum of inputs. The basic requirement for this computation is a set of predefined weights across all units. This becomes a difficulty while obtaining common set of weights. Even after selection of weights the units of parameters become an issue.

Data Envelopment Analysis (DEA) is one of the optimum tool handling such measurement problem. Developed by Charnes et al. (1978), the approach measures relative efficiencies of individual decision making units (DMU) by optimizing weighted output/input ratio. The transformation process is driven by the actions of DMU. While measuring efficiency, it can be multiple peer entities with same transformation process (for eg. Saw mills using similar techniques in the U.S.) or a single entity with different resource utilization over time. DEA is a non-parametric approach, i.e. the inputs, outputs related to the transformation process need not to have the same units of measurement (Triantis, 2012). In other words, for example labor hours, capital investment, overtime, number of machines, board feet of finished lumber, electricity consumption, CO2 emissions, waste generated etc. can be used in their original units while measuring the efficiency of the operation. This removes the need to convert all the inputs and associated outputs measures to a uniform unit. Another feature of DEA technique is weights optimization. Unlike other efficiency measurement techniques like regression analysis, there is no need to assign predefined weights to the parameters of the process. The approach sets up a frontier of efficient DMUs using relative efficiency measures (Triantis, 2012). There are different mathematical models to conduct DEA analysis but CCR (Charnes, Cooper and Rhodes) model (Charnes, Cooper, & Rhodes, 1978) and BCC (Banker, Charnes and Cooper) (Banker , Charnes, & Coooper, 1984) are most frequently used. According to Farrell (1957), technical efficiency represents the ability of a DMU to produce maximum output given a set of inputs and technology (output oriented) or, alternatively, to achieve maximum feasible reductions in input quantities while maintaining its current levels of outputs (input oriented).

DEA is specifically applicable in cases where there are no clear success parameters, and when same efficiency can be achieved using different resources combinations. Thus in such cases, measuring the degree of efficiency individual entities in relation to others acting in the similar conditions with same transformation process might be of more interest. It have been widely applied in different areas for measuring productivity and efficiency. It has also been used for making comparisons between organizations, companies, regions and countries. Application also extends in banking, agriculture, wood industry, management of renewable resources, schooling, etc. for evaluating business performance (Sporcic & Landekic, 2014). The organizations can thus learn from the best performing peers and adapt to move towards the efficiency frontier. The outputs of the analysis, depending upon the method used, also gives the excess of inputs or deficiency in outputs in comparison. That is the measure of technical efficiency. The similar analysis when coupled with the unit cost information can be used to draw allocative efficiency. These efficiency measurements and comparison with the frontiers can be used to develop strategy and benchmark performance goals and objectives.

The following section highlights few examples as possible application of this technique in efficiency measurement of different features of forest products industry.

  • Sporcic & Landekic (2014) applied this technique to measure productivity and efficiency of 48 forest management offices in Republic of Croatia. All the offices were managed by Croatian Forests Ltd. and were responsible to manage 80% of the national forest cover. The authors used most commonly used DEA models, CCR and BCC to evaluate relative efficiency. Table 1 lists the inputs and outputs used by the authors.

Table 1 List of Inputs & Outputs used by Sporcic & Landekic (2014)

Inputs Outputs
Land, (forest area in thousand hectares) Revenues, (yearly income in hundred-thousand croatian kunas)
Growing stock, (volume of forest stock in cubic meters per hectare) Timber production, (timber harvested in cubic meters per hectare)
Expenditures, (money spent in hundred-thousand croatian kunas) Investments in infrastructure, (forest roads built in kilometers)
Labor, (number of employees in persons) Biological renewal of forests, (area of conducted silvicultural and protection works in hectares)

The results included the global technical efficiency (using CCR model), local pure technical efficiency (using BCC model) and determine scale of the transformation process. The authors also calculated efficiency frontiers, number of efficient units, identify sources and values of inefficiencies and impact of structural characteristics of forest offices (number of employees, growing stocks and surface area) on their overall efficiency. The results showed that 31% of the DMUs were found efficient according to CCR model and 50% using BCC model.

  • Upadhyay, Shahi, Leitch, & Pulkki (2012) used DEA in analyzing 24 lumber mills in northwestern Ontario, Canada to measure relative technical efficiency from data over the period of 10 years (1999-2003 and 2004-2008) using the average values for each period. Table 3 lists set the 4 inputs and 1 output used in the study. The authors conducted two set of analysis with and without using energy as an input.

Table 2 List of Inputs & Outputs used by Upadhyay, Shahi, Leitch, & Pulkki (2012)

Input
Materials (Log volume) Labor (man-hours)
Energy

Hog-fuel

Electricity

Output
Lumber Volume

The results of DEA show that while some mills (DMUs) improved their performance over the two period with limited resources, others saw a decline in their performance. With considering energy as an input, more mills reported a negative change in the efficiency. One of the probable explaination by the authors for decrease in the efficiency is reduced production in the second period. Those mills failed to adjust their inputs (mainly labor) and were running with more than required resources.

  • Runsheng (1998) demonstrated the application of DEA to conduct production efficiency analysis on 65 mills producing unbleached linearboard sector in North America in 1994. Authors used 8 inputs and 1 output (Table 3) to measure the economies of scale, technical efficiency and allocative efficiency. The results showed that most of the analyzed DMUs were technically efficient but only few maintained allocative efficiency. The analysis also showed that most of the mills demonstrated constant returns to scale.

Table 3 List of Inputs & Outputs used by Runsheng (1998)

Inputs
Fiber (BDST/FST) Labor

Operating labor (MH/FST)

Salaried (MH/FST)

Chemicals (lb/FST) Materials (unit/FST)
Fuel (MCF/FST) Delivery (mile/FST)
Power (kWh/FST)
Outputs
Finished short ton production (Annual)
BDST= Bone-dry short ton, FST= Finished short ton, MCF=1000 Cubic feet, MH= manhour

Thorough just these three examples, it’s clear that Data Envelopment Analysis (DEA) is a powerful tool for relative efficiency and performance measurement. Though its application in forest products industry is fairly limited as of now as compared to other industries (Sporcic & Landekic, 2014) but it certainly has the potential to be useful tool for resource management and strategy design for the U.S. Forest Products Industry.

References

  • Banker , R., Charnes, A., & Coooper, W. (1984). Some Models for Estimating Technical and Scale Inefficiencies in Data Envelopment Analysis. Management Science, 1078-1092.
  • Charnes, A., Cooper, W., & Rhodes, E. (1978). Measuring the Efficiency of Decision Making Units. European Journal of Operational Research, 429-444.
  • Farrell, M. (1957). The measurement of productivity efficiency. Jouranl of the Royal Statistical Society, 253-281.
  • Runsheng, Y. (1998). DEA: A new methodology for evaluating the performance of forest products producers. Forest Products Journal, 29-34.
  • Salehirad, N., & Sowlati, T. (2006). Productivity and efficiency assessment of the wood industry: a review with a focus on Canada. Forest Products Journal .
  • Sporcic, M., & Landekic, M. (2014). Nonparametric Model for Business Performance Evaluation in Forestry. In J. Awrejcewicz (Ed.), Computational and Numerical Simulations. InTech. doi:10.5772/57042
  • Triantis, K. (2012). Engineering Applications of DEA. In Handbook of Data Envelopment Analysis. Kluwer Publishers.
  • Upadhyay, T. P., Shahi, C., Leitch, M., & Pulkki, R. (2012). An application of data envelopment analysis to investigate the efficiency of lumber industry in northwestern Ontario, Canada. Journal of Forestry Research, 657-684.


Research Brief: advantages and disadvantages of bio-butanol

by Li Liang, lli91@vt.edu

Renewable energy sources is an attractive option for ensuring future energy security (Sharma et al 2013), since it can reduce the fossil fuel dependency and mitigate climate change (Cherubini et al 2011). Therefore, researchers devote a lot to study and develop new energy, such as ethanol and biodiesel. However, a very potential overlooked energy substitute is bio-butanol (Kenneth 2010). Bio-butanol is an alcohol that can be used as the direct replacement for gasoline, due to its low water miscibility, similar energy content and octane number with gasoline, blending ability with gasoline in any proportion, and its directly utilization in gasoline engine(Kumar et al 2009, Gu et al 2012). Just like second generational bio-ethanol, bio-butanol is also a renewable fuel that can be produced from lignocellulose biomass through acetone butanol ethanol (ABE) fermentation (García et al 2011).

flat butanol

Besides that, compare to ethanol, butanol has the following advantages (Dürre 2007):

  • Bio-butanol can be directly used in pure form or blended in any concentration with gasoline, while bio-ethanol can only be blended up to 85% or used as pure form in specially designed engines.
  • Regardless of using bio-butanol as pure vehicle fuel or gasoline extender, there is no need to make any modification of existing car.
  • It is safer to handle, because it has a lower vapor pressure than bio-ethanol.
  • It can be blended with gasoline at the refinery before storage and distribution, because it is not hygroscopic, while bio-ethanol could only blend with gasoline just before use.
  • Since bio-butanol is immiscible with water, it is less likely to contaminate the groundwater if it spills; while bio-ethanol is completely miscible with water and will cause water-pollution when it spills.
  • Unlike bio-ethanol, bio-butanol is less corrosive, so it can be used in infrastructure, such as pipelines, tanks, filling station, pumps, and etc.
  • It has a higher mileage/gasoline blend ratio, based on its higher energy content
  • Compare to bio-ethanol, bio-butanol has a more similarity quantity of the caloric value, octane number and air-fuel ratio with real gasoline, which means bio-butanol is more similar with gasoline in characteristics.

However, there still existing some issues in the productions and utilizations of bio-butanol (Jin et al 2011):

  • The production of bio-butanol is quite low. The production rate of bio-butanol yield from ABE fermentation is 10-30 times lower than the bio-ethanol produce from yeast ethanol fermentation process.
  • Although bio-butanol has a higher energy density than other low-carbon alcoholic biofuel, its heating value is still lower than the real gasoline or diesel fuel, so it needs to increase the fuel flow when it uses as a fossil fuel substitute.
  • Bio-butanol is a kind of alcohol-based fuels, so it still cannot compatible with some fuel system components, and may cause gas gauge reading mistakes in vehicles with capacitance fuel level gauging
  • Bio-butanol may yield more greenhouse gas emissions per unit motive energy extracted compare to bio-ethanol, due to it contains fewer octane number. Higher octane number means greater compression ratio and efficiency, and higher engine efficiency can achieve less greenhouse gas emissions.
  • The higher viscosity of bio-butanol may lead to a potential corrosive or aggradation problem when it was used in Spark-ignition engines.

From the above illustration, we can see that although bio-butanol still need some further developments, since it still has some issue. However, compare to the other lignocellulose bio-fuel it has much more advantages, such as compatibility with infrastructure and relatively less pollution. Therefore, with further improvements or upgrade, the bio-butanol are believed to be the next generation biofuel, since it can reduce the carbon footprint, mitigate the supply and price fluctuation during the transportation sectors, relieve the energy security problem, and provide related job opportunities to improve social equality (Yue et al 2014).

References:

  • Szulczyk, K.R. (2010). Which is a better transportation fuel – butanol or ethanol? International journal of energy and environment, 1 (2010) 501-512
  • Sharma, B; Ingalls, R.G; Jones, C.L; Khanchi, A. (2013). Biomass supply chain design and analysis: Basis, overview, modeling, challenges, and future. Renewable and Sustainable Energy Reviews, 24 (2013) 608-627
  • Cherubini, F; Strømman, A.H. (2011). Life cycle assessment of bioenergy systems: state of the art and future challenges. Bioresource Technology, 102 (2011) 437–451
  • Kumar, P; Barrett, D.M; Delwiche, M.J; Stroeve, P. (2009). Methods for Pretreatment of Lignocellulosic Biomass for Efficient Hydrolysis and Biofuel Production. Industrial and engineering chemistry research, 48 (2009) 3713-3729
  • Gu, X; Huang, Z; Cai, J; Gong, J; Wu, X; Lee, C. (2012). Emission characteristics of a spark-ignition engine fuelled with gasoline-n-butanol blends in combination with EGR. Fuel, 93 (2012) 611–617
  • García, V; Päkkilä, J; Ojamo, H; Muurinen, E; Keiski, R.L. (2011). Challenges in biobutanol production: How to improve the efficiency? Renewable and sustainable energy reviews, 15 (2011) 964–980
  • Dürre, P. (2007). Biobutanol: an attractive biofuel. Biotechnology journal, 2 (2007) 1525-1534
  • Jin, C; Yao, M; Liu, H; Lee, C.F; Ji, J. (2011). Progress in the production and application of n-butanol as a biofuel. Renewable and sustainable energy reviews, 15 (2011) 4080-4106
  • Yue, D; Slivinsky, M; Sumpter, J; You, F. (2014). Sustainable design and operation of cellulosic bioelectricity supply chain networks with life cycle economic, environmental, and social optimization. Industrial and Engineering Chemistry Research, 53 (2014) 4008–4029