Using Statistical Process Control to Improve Quality in the Wood Products Industry

By Sevtap Erdogan, Email: serdogan@vt.edu

While other industries have been using Statistical Process Control (SPC) to control quality for decades, the wood products industry has been relatively late in adopting SPC. It was not until the 1980s decade when wood products companies began to use SPC practices as a way to address quality concerns after a renewed focus on quality by American consumers (Young and Winistorfer, 1999). Within the wood products industry, statistics have especially been under-used as a way to control quality in hardwood lumber products. However, the decreasing supply of timber, and therefore rising product costs, may cause more wood products companies to reconsider the use of SPC (ibid.). Statistical Process Control is a method to incorporate continuous statistical analyses during production in order to improve quality. Young and Winistorfer (1999, p. 11) define SPC as using statistics “to achieve and maintain control of process and production within a repetitive manufacturing process.” In addition, Srinivasu, Reddy, and Rikkula, (2009, p. 15) note that SPC aims to “control quality characteristics on the methods, machine, products, [and] equipments both for the company and operators.”

Figure 1. Variable Control Chart for Product Specification Variations (Young and Winistorfer 1999)

Quality control charts are primarily done through identifying and minimizing of variation. When the process is out of control, the sources of variation need to be identified and eliminated. These systematic issues could arise from issues with raw materials, equipment, or operating procedures (Srinivasu et al., 2009; Young and Winistorfer, 1999). Only random variations are allowed as a result of the natural variation of the process. Figure 1 provides a basic example of a control chart used to identify variations in product quality


Figure 2. Sample Pareto Analysis Chart Identifying Wood Products Nonconformities (Leavengood and Reeb 2002)

In order to minimize variability, companies have incorporated Pareto analyses as part of their SPC initiatives (Leavengood and Reeb, 2002; Young and Winistorfer, 1999). Pareto analyses are based on the principle that approximately 80 percent of problems are caused by 20 percent of the possible causes (ibid.). Therefore, SPC and Pareto analyses can help prioritize quality problems for a company to address and to focus on the “vital few” problems instead of the “trivial many” (Leavengood and Reeb, 2002, p. 2). In order to adopt Pareto analyses. Several steps can help ensure the effectiveness of Pareto analysis in SPC. First, companies should develop a standardized list of criteria to identify what can be identified as a “nonconformity”, and then provide a clear definition of the criteria and a definition of the nonconformity (Leavengood and Reeb, 2002). Next, companies should develop a standardized way of categorizing these nonconformities. Within the context of the wood products industry, for example, “one person may call an item with torn grain a machining defect, another might call it fuzzy grain, and another may call it reaction wood” (ibid., p. 3). Once company staff have collected data on a number of nonconformity issues, Pareto analyses require that the frequency of these issues is charted for each category of nonconformities after sorting nonconformities from highest to lowest frequency and determine the relative frequency for each (Leavengood and Reeb, 2002). Figure 2 provides an example of what one of these charts may look like. In addition to generating and analyzing control charts based on continuous variables, attribute control charts can help control the production process of a company when measurements such as good or bad, accept or reject, go/no-go, or pass or fail criteria are used.

For the implementation of these SPC practices to be effective, SPC is meant to include several continuous improvement principles. SPC first applies continuous improvement principles by having measurements taken continuously and through all steps of the production process (Young and Winistorfer, 1999). This allows for problems to be detected early on, which can save costs compared with only identifying a flaw after the completion of the production process. In addition, Young and Winistorfer (1999) state that for SPC to be effective companies should incorporate continuous improvement principles such as having staff from all levels of a company (operators, operator assistants, supervisors, and top management) involved in the decision making process. The authors also suggest that companies continuously reward and acknowledgement of employees and tie these rewards and acknowledgements to the results of SPC.

By using the discussed strategies, wood products companies can incorporate statistical analyses in identifying product errors and in improving quality. Implementing SPC in a process that incorporates continuous improvement principles can allow the quality of wood products to meet the needs and desires of customers. It can also save costs for a company throughout the production process.

References:

  • Leavengood, S. A., & Reeb, J. E. (2002). Statistical process control part 3: pareto analysis and check sheets. Corvallis, Or.: Extension Service, Oregon State University.
  • Maness, T. C., Kozak, R. A., & Staudhammer, C. (2003). Applying Real-Time Statistical Process Control to Manufacturing Processes Exhibiting Between and Within Part Size Variability in the Wood Products Industry. Quality Engineering16(1), 113-125.
  • Srinivasu, R., Reddy, G. S., & Rikkula, S. R. (2009). Utility of quality control tools and statistical process control to improve the productivity and quality in an industry. International Journal of Reviews in Computing2, 15-21.
  • Young, T. M., & Winistorfer, P. M. (1999). Statistical process control and the forest products industry. Forest products journal49(3), 10-17.

RESEARCH BRIEF: Inventory management in supply chain

Li Liang, Doctoral student. Email lli91@vt.edu

Inventory management is an indispensable part in the supply chain management, since it covers the aspect of logistics, operations, marketing, finance, and information systems (Sprague, Sardy, 2009). For example, in the aspect of finances, the inventory management may associate with item, carry, ordering, stock out, and capacity associated costs ( Arnold et al. 2008). In relationship to operations, inventory management need to manage the stock at an optimal level and determine the quality of this inventory to satisfy the needs of manufacturing and customer demands (Bayraktar, 2012). In terms of marketing and information system aspects, inventory management may relate to the demand forecasting and information sharing (Smart, 2008).

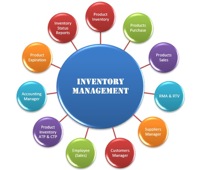
Fig. 1. Inventory management relationships.

The schematic shown in Fig. 1 gives a more directly and comprehensive oversee of inventory management.  Inventory management takes part in the whole value-added chain. Perhaps the most significant subject of research in inventory management is to understand how to manage stock. Yue (2002) constructed two models derived from a pipeline hedging method to evaluate the reduction of safety stock when redesigning a manufacturing process. Model one was used to study the product family with one product and focused on operation re-sequencing; while model two was used to study the product family with two products and focused on merging of operation. The result showed that both the merging and re-sequencing could significantly minimize the safety stock level.

Singh and Kumat (2011) proposed an efficient method based on the Genetic Algorithm to determine the most probable shortage level and additional stock level for inventory optimization in supply chain so that the total cost could be minimized. Liou et al (2013) introduced the Stackelberg equilibrium framework with the objective of maximizing the total benefit for vendors and with the restriction of minimizing the total cost to an acceptable level when studying one seller, one buyer, finite horizon, and multi-period inventory model. Liou concluded that the Stackelburg equilibrium could obtain the optimal condition and optimal replenishment policy, and the optimal replenishment policy could be found by a numerical algorithm.

Mekel (2014) used a quantitative method of forecasting calculation with double exponential smoothing models to predict the level of demand from 2013 to 2014, through deciding the safety level and re-order point to know how much inventory should be anticipated and when should be ordered, also, the author used Economic Order Quantity calculation to know the amount of orders of raw material at the lowest cost.

In conclusion, inventory management is still playing an important role in supply chain management. And much of the current literature focus on using innovative method to forecast and lower safety stock level. The future research may continue study the innovative methodologies to obtain the optimal condition for the supply chain management problem.

References

  • Sprague, L.G; Sardy, M.J. (2009) Some surprising new about classical view on inventory and some nonclassical responses to traditional practice. Inventory management, 2 (2009) 25-30
  • Arnold, T; Chapman, S; Clive, L. (2008). Introduction to materials management. New jersey: Pearson Education.
  • Bayraktar, E; Ludkovski, M. (2010). Inventory management with partially observed non-stationary demand. Annals of operation research, 176 (2010) 7-39
  • Liou Y.C; Schaible, S; Yao J.C. (2013). Supply chain inventory management via a Stackelberg equilibrium. Journal of industrial and management optimization, 9 (2013) 81-83
  • Smart, C.N. (2008). The Relationship Between Forecasting and Optimal Stocking Levels. APICS-The Performance Advantage.
  • Singh, S.R; Kumar, T. (2011). Inventory optimization in efficient supply chain management. International journal of computer applications in engineering science. 1 (2011) 428-433
  • Yue, X.H. (2002). Emerging problems in supply chain management, (2002) 10-94
  •  Mekel, C; Anantadjaya, S; Lahindah, L. (2014). Stock Out Analysis: An Empirical Study on Forecasting, Re-Order Point and Safety Stock Level at PT. Combiphar, Indonesia. Review of Integrative Business and Economics Research, 3 (2014) 52-64

RESEARCH BRIEF: Kaizen Continuous Improvement and the Wood Products Industry

by Sevtap Erdogan, MS Candidate, serdogan@vt.edu

Unlike other traditional manufacturing practices such as mass production and craft manufacturing, the Kaizen production management method is a determined technique to achieve quality, functionality, and prices to sustain product competitiveness (Modarress et al., 2005). Kaizen comes from the Japanese term (“Kai” meaning “change” and “Zen” meaning “good”) used to define continuous improvement, especially to maintain low cost and less inventory (Palmer, 2001). First developed in Japan by Toyota in the 1970s, the Kaizen method increased production and competiveness within the automotive industry by using small teams of members with different functional skill sets to work together in order to meet specific goals (Doolen, Van Aken, Farris, and Worley, 2007). This was done under an accelerated timeframe and with the aim of improving a targeted work area.

creative safety supplyThe primary strategy to implement Kaizen is working together within the company to achieve improvements with less capital investment. In contrast to traditional improvement approaches in which employees can only suggest changes that then must be approved throughout their organization, the Kaizen method allows for team members to implement changes and see the effects of their efforts (Farris et al., 2008). The Kaizen method also distinguishes itself from other methods in its clear and active participation of company workers in industrial engineering and job design (Wood, 1989). This Kaizen strategy of working collaboratively within an organization has been shown to increase employee participation and morale, and also increase trust between managers and employees (Farris et al., 2008). Such ongoing and active engagement of all members within an organization highlights Kaizen’s commitment to continuous improvement principles. If done correctly, Farris et al. (2008, p. 11) state that the implementation of Kaizen principles, called a Kaizen event, can improve both a company’s “technical system (i.e., work area performance)” as well as its “social system (i.e., participating employees and work area employees).”

Several factors have been identified to increase the likelihood of successfully implementing Kaizen principles and improving company outcomes. These factors include creating mutual respect and open communication among project team members, creating clear and focused team goals, and tracking lean manufacturing tools in less complex areas where work is predictable and repetitive (Doolen et al., 2007). In order for Kaizen method to succeed, managers need to support these processes and set goals challenging enough to encourage creative thinking but yet not overly difficult (ibid.).

In contrast, Farris et al. (2008) identify factors that can limit the effectiveness of Kaizen events. For example, the authors conducted a case study in which the Kaizen project goals were communicated by management to employees in a one-way and top-down format, and without explaining the business issues and reasons behind the project goal. The authors cited this communication strategy as a cause of the team’s confusion and failure to understand or meet managers’ expectations. In addition, team members were said to not have been given sufficient decision making ability and autonomy from company managers. Such negative factors limit the continuous improvement principles necessary for Kaizen to be successful.

While originally applied to the automotive industry, the Kaizen method of targeting low-cost and creative solutions has increasingly been used within the wood products industry (Doolen, et al., 2007; Farris et al., 2008). In their survey of Wood Component Manufacturing Association member companies, Pirraglia et al. (2009) found that 50 percent of surveyed companies stated that they used Kaizen events to implement lean manufacturing, making Kaizen events one of the most popular types of lean manufacturing methods within the wood products industry. Kaizen events were also found to be used most frequently by wood products companies in the early stages of lean manufacturing implementation.

These survey data are further supported by case study research, such as Czabke’s (2007) case studies of U.S. and German wood products companies. For example, Czabke (p. 65) found that “according to interviewed managers some areas had efficiency increases of 100% after just one kaizen event.” Using the Kaizen costing method, one of these companies, a small manufacturer of antique replicas with 143 employees at the case site, reduced lead time from 16 to 6 weeks, reduced cycle time from 45 to 4 days, and increased productivity from 16 to 60 items per day while also increasing profitability and safety.

In conclusion, Kaizen practices offer a new and cost-effective way for wood product companies to achieve continuous improvement and increase their competitiveness. While the available literature on Kaizen method is still limited in regards to the wood products industry, the initial research provides evidence of the positive effects of Kaizen practices for wood products companies. Research should continue to focus on this important continuous improvement strategy as it is applied within the wood products industry, and wood products companies should consider implementing Kaizen practices to innovate and improve.

References

  • Czabke, J. (2007). Lean thinking in the secondary wood products industry: challenges and benefits (Doctoral dissertation).
  • Doolen, T. L., Van Aken, E. M., Farris, J. A., & Worley, J. (2007). Designing Kaizen Events for Success. In Proceedings of the 2007 IIE Annual Conference and Expo (pp. 19-23).
  • Farris, Jennifer A., et al. “Learning from less successful Kaizen events: a case study.” Engineering Management Journal 20.3 (2008): 10-20.
  • Modarress, B., Ansari, A., & Lockwood, D. L. (2005). Kaizen costing for lean manufacturing: a case study. International Journal of Production Research,43(9), 1751-1760.
  • Palmer, V. S. (2001). Inventory management KAIZEN. In Engineering Management for Applied Technology, 2001. EMAT 2001. Proceedings. 2nd International Workshop on (pp. 55-56). IEEE.
  • Pirraglia, A., Saloni, D., & Van Dyk, H. (2009). Status of lean manufacturing implementation on secondary wood industries including residential, cabinet, millwork, and panel markets. BioResources4(4), 1341-1358.
  • Wood, Steven. 1989. “The Japanese Management Model: Tacit Skills in Shop Floor Participation” Work and Occupations November 1989 16:446-460.

Competitiveness and Value Creation

by Edgar Arias, Post-doctoral Research Associate. earias@vt.edu

In order to move and organization from its current state to a new stronger one, business strategies need to be formulated to improve the organization’s competitiveness (Feurer & Chaharbaghi, 1994). The capabilities and competences that an organization possess to persuade a customer to prefer its products and services over the competition are the essence of competitiveness.  To understand these capabilities and competencies, and their potential to deliver competitive advantage, the organization cannot be seen as a whole.  Instead, it needs to be regarded as a collection of discrete activities, which are performed in alignment with the organization’s business strategies. Value chain is a tool designed by Porter (Porter, 1985) to systematically divide a firm into its “strategically relevant” activities, analyze their behavior and interaction, and determine their importance in the implementation of business strategies. The term value is utilized in this context to denote the potential of these activities to deliver the firm’s value proposition (Kaplan & Norton, 2000). In Porter’s model, depicted in Figure 0, the value chain activities can be divided in two categories: primary activities and support activities.  The primary activities are those related to the physical creation and delivery of the product to the customer, whereas support activities are involved in the procurement and management of the resources needed by the primary activities to operate.

Figure. The Generic Value Chain

According to this model, value is created by operating a firm in such a way that the end product or service, has built-in features, for which the customers are willing to pay a price. Bowman et al. argue that value may actually take two forms: the exchange value, which corresponds to the model just explained; and the perceived value, which is subjectively determined by the customer (Bowman & Ambrosini, 2000).  Under this paradigm, the value of the characteristics of products and services, varies from one context to another (e.g. by region or stage in the product life cycle).  This variability in the value of a product or service, is addressed by Hill in his order winner/order qualifier framework (Hill, 2000).  In accord with Hill’s model, which was originated in the field of manufacturing theory (Hofmann, Beck, Füger, & SpringerLink, 2013), the order qualifiers represent aspects of a product or service required for a customer to consider buying it.  The order winners on the other hand, consist in characteristics that position the product or service above those of the competition.  Understanding the difference between these two concepts, and how they materialize in any given industry, is critical for an organization’s strategic planning process.  Therefore, understanding such aspects of the hardwood export business is one of the main themes of this teams’ research projects.

The concepts presented up to this point – value chain, order winners and qualifiers, are based on the assumption that attaining competitive advantage depends on the organization’s resources, value activities, on the characteristics of products and services, and how these are valued by customers.  However, previous research on international marketing also suggests that, the context in which the firms operate, both locally and internationally, along with the characteristics of the organization themselves, play a key role in its competitiveness.  This field of study has coined the term “export performance” to address the factors that determine the success of a firm in achieving its objectives in international markets.  A future note on this subject will address the research conducted by the SIM team on the forest products industry.

References

  • Bowman, Cliff, & Ambrosini, Veronique. (2000). Value Creation versus Value Capture: Towards a Coherent Definition of Value in Strategy. British Journal of Management, 11(1), 1-15.
  • Feurer, Rainer, & Chaharbaghi, Kazem. (1994). Defining Competitiveness: a Holistic Approach. Management Decision, 32(2), 49-58.
  • Hill, Terry. (2000). Manufacturing Strategy: Text and Cases. Boston, Mass: Irwin/McGraw-Hill.
  • Hofmann, Erik, Beck, Patrick, Füger, Erik, & SpringerLink. (2013). The Supply Chain Differentiation Guide: A Roadmap to Operational Excellence. Berlin, Heidelberg: Springer Berlin Heidelberg.
  • Kaplan, R. S., & Norton, D. P. (2000). Having Trouble with your Strategy? Then Map It (Vol. 78, pp. 167-167). United States: Harvard Business School Publishing Corportation.
  • Porter, Michael E. (1985). Competitive advantage: creating and sustaining superior performance (pp. 33-61). New York: Free Press.

Workshop: International Marketing for Forest Products Industries

2014_IMW_1

Date: Friday, December 12, 2014

Location:

National Hardwood Lumber Association headquarters
Raleigh Lagrange Rd, Memphis, TN 38134
Phone: (901) 377-1818

Brought to you by:

  • The Federal State Market Improvement Program (FSMIP) at USDA
  • The Center for Forest Products Business at Virginia Tech
  • The National Hardwood Lumber Association (NHLA)

 Overview

With  $123.78 billion in shipments in 2011 and more than 710.7 thousand workers, the wood products industry in the United States has become an important link in the economy of the country. Today the industry has suffered many drastic changes due to the rapidly increasing global competition that has pushed the local industry to look for different ways to remain competitive. Manufacturing cost issues, lack of innovation, and poor understanding of customer needs remain as the biggest challenges that the wood products industry still is trying to address and in the last 10 years, other issues have arisen such as logistics costs, lead times, product customization, forest certification, and information technologies.

With this context in mind, today’s wood products companies should be very careful when developing new markets, especially if these new markets are international. Certain European and Asian markets are more receptive to US wood products because there is a reputation of sustainability attached to the product. Also, US wood products offer uniqueness in terms of attractive aesthetics, supply chain reliability, and high quality standards.

Who Should Attend?

  • Sales Managers, Export Sales Managers, Sale Representatives
  • General Managers, Plant Managers, Purchasing Managers, Materials Planning Managers, Marketing Directors, Product Managers, Plant Supervisors
  • Employees with responsibilities in Marketing that would like to increase their knowledge of the current situation for US Wood products in international markets
  • Owners and managers of Small and Medium Enterprises in wood products industries
  • Personnel related to local organizations that support development of new market opportunities for wood products industries
  • Independent consultants and academicians who are interested in updating their knowledge in international marketing for US Wood products

Why You Should Attend?

  • Understand the basics of marketing in a wood products organization
  • Apply basic marketing tools to turn an idea into a commercially successful product
  • Obtain recent marketing intelligence information on specific global markets
  • Explore potential opportunities to export to Central America
  • Understand the basics issues of supply chain management involved in international trade

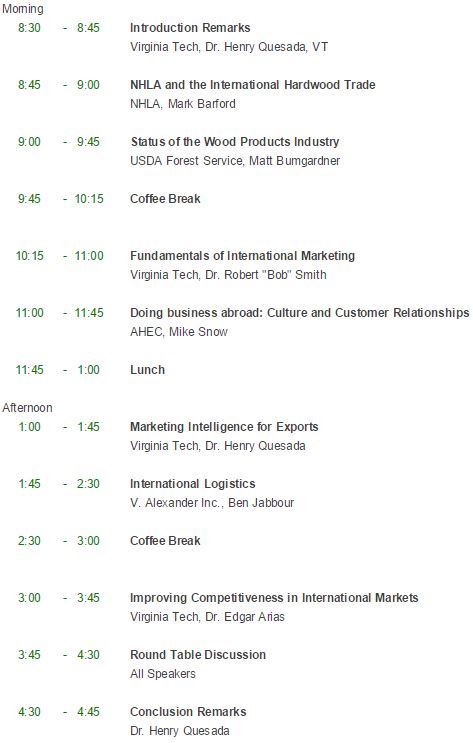
Agenda:

Agenda_12.10.14


Registration:

Investment: $250.00
Investment covers workshop materials, coffee breaks, and lunch
Registration Link: International Marketing for Forest Products Companies Workshop

For more information on this workshop contact:

Becky Miller, b.miller@nhla.com. NHLA
Edgar Arias, earias@vt.edu. Virginia Tech