RESEARCH BRIEF: The Forest Products Industry of the Appalachian Region

by Scott Lyon, MS Candidate
Virginia Tech

The Appalachian region consists of 205,000 square miles from southern New York to northern Mississippi, also including Pennsylvania, Ohio, Maryland, West Virginia, Virginia, North Carolina, South Carolina, Tennessee, Kentucky, Georgia, and Alabama (Figure 1; Appalachian Regional Commission 2010).  The economy in this region was fueled historically by forestry, mining, farming and industry and currently, the region is primarily involved in a mix of manufacturing and service industries (Appalachian Regional Commission 2010). Because of diversifying the economy, the amount of distressed counties in the region has been reduced from 223 in 1965 to 82 counties in 2010 (Appalachian Regional Commission 2010).
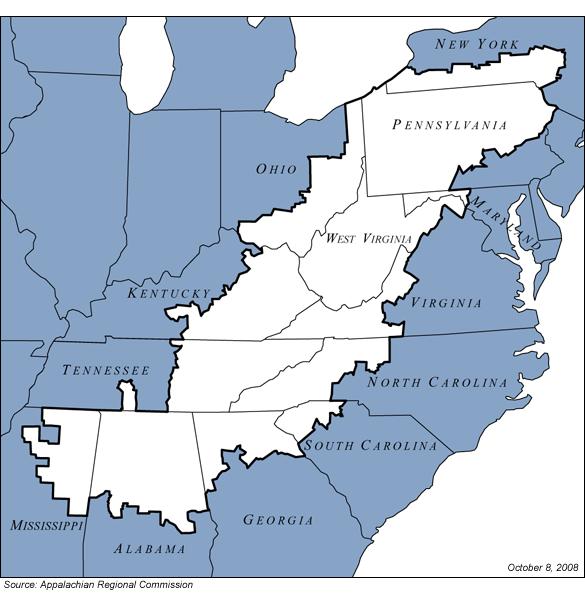
Figure 1. Appalachian Region Map (ARC 2010)

The manufacturing of forest products in this region is an essential sector of the economy employing over 1.1 million people (Murphy et al. 2008; NC-IOF & NCFA 2003; NESFA 2001; SCFC 2006; Ammerman Unknown Date; PFPA 2005; Young et al. 2007; VDACS 2008; Childs 2005; EDPA 2010; Ervin et al. 1994, McClure 2008, Mississippi State University 2010).  An increase in global competition has caused the decrease of domestic markets for U.S. furniture and this increase of competition has taken a toll on the Appalachian hardwood lumber industry (Bowe et al. 2001). The forest products industry in the Appalachian region must be innovative in their marketing strategies to find potential markets for their products (Naka et al. 2009). Other factors affecting the forest products industry has been urbanization, land development and population growth that have decreased the amount of timber available to the forest products industry (Young et al. 2007). 

 The hardwood industry in Pennsylvania is the top producer of hardwood lumber in the country manufacturing 10% of the total production in the United States (PFPA 2005; Smith et al 2003). Alabama ranks number two in timberland resources with 23 million acres of forestland fueling 850 forest product mills (EDPA 2010).  Hardwood lumber mills range in size from producing 1 million board feet (MMBF) to over 40 MMBF a year (Smith et al 2004). Some Appalachian mills have increased the amount of value-added products/processes available to customers in order to increase market size and sales. These value-added processes include: kiln drying, custom sorting/grading, S4S, finger jointing, and dimension manufacturing (Smith et al. 2004).  Low grade sawlogs and small-diameter logs were not used traditionally in lumber production in the Appalachian region.  The introduction of oriented strandboard mills (OSB), parallel-strand lumber mills (PSL) and rotary-cut plywood mills have allowed the forest product industry to expand the use of low grade raw material and make it value-added product (Luppold et al. 1998).    

The forests in this region grow a large variety of hardwood and softwood timber species that are harvested for wide assortment of forest products (VDACS 2008).  A variety of hardwood timber species primarily grow in the Appalachian region (Table 1). These species are used in many different end-use applications including: pallets, furniture, flooring, cabinets and millwork (Adams 2002; Virginia Department of Forestry 2007). 

Table 1. Hardwood Species Grown in the Appalachian Region (Adams 2002, VDOF) 

Common Name Scientific Name
red oak Quercus rubra & Quercus falcate
white oak Quercus alba
hard maple Acer saccharum
soft maple Acer rubrum & Acer saccharinum
black walnut Juglans nigra
yellow-poplar Liriodendron tulipifera
black cherry Prunus serotina
American basswood Tilia americana

Softwood lumber species grown in this region include: Eastern white pine (Pinus strobus), and Southern Yellow Pine (Pinus palustris, P. elliotii, P. taeda, P. echinata).  These softwood species are primarily used as lumber for construction applications, furniture, cabinets, and other interior uses (Virginia Department of Forestry 2007). 

Not only does the forest have a significant impact on the region’s economy but it also helps control water and air quality creating benefits the local communities (Childs 2005; Virginia Department of Forestry 2007). Components of the forest ecosystem work together to reduce the amount of storm water runoff entering nearby watersheds.  In urban areas, forests help lower the amount of runoff by collecting it in leaves, branches and soils (American Forests Unknown Date).  Forests produce organic compounds that reduce the amount of air pollution in an area.  A study in Chicago, Illinois, found that urban trees helped decreased the amount of toxic emissions in the air surrounding the city (Nowak 1994). The Appalachian forests provide a variety of benefits to both humans and the environment.  The forest products industry provides to local economies with added jobs and revenues.  The forests also provide a renewable resource that can be sustainably harvested.

References:

Please email Scott Lyong at swlyon@vt.edu to request the list of references.

RESEARCH BRIEF: Engineering Change Orders (ECOs), an important engineering performance indicator

By Chao Wang, MS Candidate
Department of Wood Science and Forest Products
Virginia Tech

What are Engineering Change Orders (ECOs)?

ECOs are also called Engineering Change Notices (ECNs) or just Engineering Changes (ECs). ECOs are a significant driver of product development costs and lead time (Loch and Terwiesch 1999). Engineering changes (ECOs) refers to making design changes to an existing product (Barzizza, Caridi, and Cigolini 2001). It includes changes for improving production efficiency as well as the changes for assuring product quality and performance (Balakrishnan and Chakravarty 1996).

Types of ECOs

(Barzizza, Caridi, and Cigolini 2001) categorized ECOs as “scrap”, ”rework”, and ”use-as-is”. “scrap” means serious technical faults and user safety problem and needs to be solved immediately. “Scrap” will directly affect the work in progress (WIP) inventory since all these inventory cannot be applied to other products. ”Rework” means ECOs are required for improvements of pre-change WIP without affecting finished products and components. ”Use-as-is” means a product has no technical faults and user safety problem but need to improve product design.

Engineering Performance of Furniture Industry

Figure 1. Causes of Engineering Errors

ECOs are also one of the reflections of engineering performance in the furniture industry. According to our interview, furniture engineers spend over 50% of their available engineering time on issuing ECOs for late design changes and architecture modifications. ECOs could be classified as ECOs for engineering errors and ECOs for engineering improvements. Less engineering errors could not only ensure product quality, but also could shorten the time-to-market and reduce the production cost. In order to find what are the most frequently occurred errors, a Pareto analysis could help us to have an idea on what the major contributors are. Figure 1 showed a Pareto Analysis of the engineering performance of a solid wood furniture company. The ECOs data represents a single month in that company. The number of ECOs issued for correcting engineering errors accounted for 98.67% of all the ECOS issued during this month. The rest 1.33% were ECOs for product improvements. From Figure 1, we could observe that “drawing error”, “part dimension error” and “wrong selection of hardware” take over 80 percent of the total engineering errors (most critical ones according to Paretto Analysis). Specifically, “drawing error” accounts for 44% of all the errors. Followings are” part Dimension Error” which accounted for 32%, “Wrong selection of hardware” accounted for 10%, “Hardware missing” accounted for 9%, “Wrong numbers of hardware” accounted for 3%, “Dimension missing” and “Missing drawings” both accounted for 1%.

Knowing what are the major causes of engineering error is important because ECOs (for correcting the engineering errors) are a type of waste which requires a lot of rework and iteration period. The Pareto Analysis can help us to find the major causes, and then we could try to find effective methods to eliminate these wastes.

Reference:

  • Balakrishnan, N., and A. K Chakravarty. 1996. Managing engineering change: Market opportunities and manfucturing costs. Production and Operations Management 5, no. 4.
  • Barzizza, R., M. Caridi, and R. Cigolini. 2001. Engineering change: a theoretical assessment and a case study. Production Planning & Control 12, no. 7: 717–726.
  • Loch, C. H, and C. Terwiesch. 1999. Accelerating the process of engineering change orders: capacity and congestion effects. Journal of Product Innovation Management 16, no. 2: 145–159.

Quesada’s research group attended 64th Forest Products Society International Convention

    Article published in Newsletter InsideVT Wood 5(6). See complete newsletter here

    Drs. Henry Quesada and Tom Hammett lead the Virginia Tech delegation to the 64th Forest Products Society Annual International Convention (IC) in Madison ,Wisconsin, during June, 2010. This year’s IC saw nearly four hundred participants –an increase over recent year’s attendance, in spite of the poor economy. Dr. Quesada’s research group presented four papers and two posters and chaired a session. Dr. Hammett presented two papers, one with his former PhD student, Richard Bonsi, and displayed two posters. Tom was also an invited participant in a strategic planning “listening session” held just prior to the beginning of the IC. The FPS is conducting a year-long effort to re-position itself so that it is more responsive the needs of its members and clients. Tom joined 25 other key stakeholders including present and former board members to help gather information and start a list of priorities that will help chart new directions for FPS.

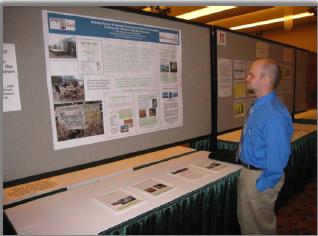
    Graduate student Scott Lyon examining one of the posters presented by Virginia Tech personnel at the FPS 64thIC.
    In addition to Henry and Tom’s participation at the annual convention, several graduate students also attended. Scott Lyon and Johanna Madrigal presented papers, and Amy Jahnke, Wang Chao, and Scarlett Sanchez displayed posters on their research. Also Post-Doctoral Associate Gi Young Jeong presented two papers. There were several positive comments, especially from some of the foreign participants (from over thirty countries!), who especially appreciated the high quality of the technical presentations.

RESEARCH BRIEF: Growth strategy opportunity for Wood Products Industry: Research and Development

by Johanna Madrigal
Ph.D. Candidate, Virginia Tech
 

The Frascati Manual indicates that Research and Development (R&D) expenditures in The United States of America (USA) are classified by the North American Industry Classification System (NAICS) and under three research categories. These three categories are: (1)Basic research that covers all the experimental and theoretical work developing knowledge for the foundation of a topic but with no defined application or use; (2) Applied research which is knowledge developed through original investigation aiming an objective; and (3) Experimental development that is created under a systematic work, developing knowledge or using existing knowledge, targeting improvement of current material, products, process and services or the development new materials, products, processes and services. In 2008, R&D expenditures in the USA were approximately $397 billion. Out this total, basic research accounts for 17% ($69.15 billion), applied research for 23% ($88.59 billion), and development for about 60% ($239.89 billion)  according to the National Science Foundation (NSF 2010). 

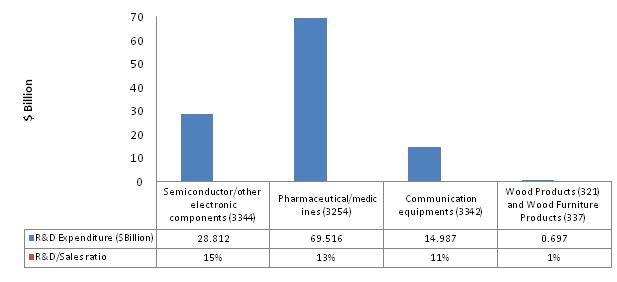
At the industry level, these expenditures were mostly performed by the pharmaceuticals/medicines (NAICS code 3254), the semiconductor/other electronic components (NAICS   code 3344),  the communications equipment (NAICS code 3342), and Software publishers  (NAICS code 5112) sectors. This last sector has the highest ratio of R&D as a share of sales.   Table 1 shows the data corresponding to R&D expenses and sales for these industries (Wolfe, 2010). 

Table 1. R&D expenses as a share of sales. (Wolfe, 2010)

Industry (NAICS code) Sales worldwide ($ million) R&D expenditure ($ million) R&D as a share of sales
Semiconductor/other electronic components (3344) 192,258 28,812 15%
Pharmaceutical/medicines (3254) 529,601 69,516 13%
Communication equipments (3342) 132,307 14,987 11%
Software publishers (5112) 317,084 35070 11%

In the wood products industry data show that the primary wood products (NAICS code 321) and the secondary wood products sector (NAICS code 337) spent together $0.697 billion in 2008, which is less than 1% of total sales, similar to what happened in 2006 in this industry (Wolfe 2010). As a comparison, the overall ratio of R&D expenses to sales in the manufacturing industry in US was approximately 4% in 2006. This might be indicating that perhaps wood products industries need to increase their investments in R&D activities in order to increase their sales.  Figure 1 shows a comparative chart of R&D expenditures as a ratio of sales for some industries including wood products.

Figure 1. R&D expenditure by selected industry (Wolfe, 2010)

 This situation shown in Figure 1 might be an indication that R&D expenditures (as a measure of Innovation) must could be defined as a sustainable growth strategy for the Wood Products Industry if the business wants to remain competitive and profitable.

References:

National Science Board. (2010). Research and development: essential foundations for U.S. competitiveness in a global economy. A companion to Science and Engineering Indicators – 2008. NSF.

Wolfe, R. (2010). U.S. Businesses Report 2008 Worldwide R&D expense of $330 billion: findings from new NSF survey. NSF. 10, 322 

RESEARCH BRIEF: Opportunities for Virginia Forest Product Companies in Central America

By Scott Lyon, MS Candidate
Virginia Tech

Introduction 

In the future, there will be a greater need for international forest products in Central America due to increasing population size, deforestation, and tourism.  According to Salamone (2000), “the United States forest product companies have overlooked Central America as an opportunity to expand their markets.” Due to improvements in health care, sanitation and education the Central American population has almost quadrupled from 11 million in 1950 to 40 million in 2008 (Fox 1990; World Bank 2010).  

Deforestation has been and continues to be a major issue today for all Central American countries. The Panamanian government removed Law No. 7 that provided tax incentives for landowners to reforest their properties. This removal resulted in illegal logging and a decrease of reforestation projects (Munoz 2007). The natural forests of Costa Rica have been exploited due to shortages of wood for housing and furniture (Montagnini et al 2003). 

Even in a global recession, tourism has been growing in Central American countries.  Nicaragua had an 11% increase in tourists in the first five months of 2009 (Rogers 2009) and in the first year of breaking ground for the expansion of the canal in 2007, Panama has experienced an 11.2% increase in investment for tourism. Another example is Ecotourism, that has played a big part in Central America’s tourism trade since 8% of the world’s animal and plant species live in Central America (Schieber 2009).  More wood products will be needed as tourism increases in Central America; a shortage of hotel rooms was observed in 2007 due to a 19% increase in tourism since 2005 (Fallas 2008). 

The purpose of this research is to evaluate potential market opportunities for Virginia forest product companies in Central America. 

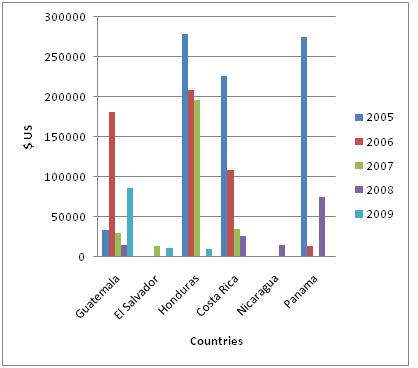
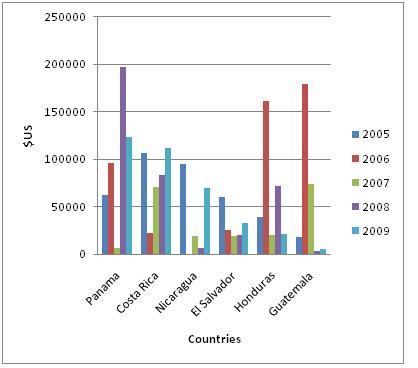
Virginian forest product companies have reduced the amount of wood products and furniture exported to Central American countries  (Figures 1 and 2) because past unstable financial markets, higher freight rates, tighter credit lines, and soft housing markets (VDACS 2008). The North American Industry Classification System (NAICS) for wood products manufacturing (321) and furniture and related products manufacturing (337) exported from Virginia to Central America is shown is Figures 1 and 2, respectively. 

Figure 1. Exports of NAICS 321 from Virginia to Central American Countries

In 2009, Guatemala, El Salvador and Honduras were the only Central American countries importing wood products from Virginia (Figure 1).  Most Central American countries increased in amount of furniture and furniture parts being imported from Virginia in 2009, except for Panama (Figure 2).     

Figure 2. Exports of NAICS 337 from Virginia to Central American Countries

In spring 2010, the research team from Virginia Tech visited top forest product importers in Panama and Costa Rica.  The objectives for the visit were to (1) investigate local production, (2) investigate local demand, (3) identify potential trade barriers, and (4) look into the future demand and production for wood products. 

Methods 

Personal interviews were conducted with Costa Rican and Panamanian forest product companies, and governmental and non-governmental agencies. Two questionnaires were developed from secondary research of the Central American forest product market. 

Results 

The Costa Rican and Panamanian governmental officials stated that their governments do not promote the use of wood products in their country.  Due to lack of government support the state of the forest products industry in Panama has declined since 1993 and today only 5 companies exist with more than 50 employees in Panama.  The forests are owned by the government and a request to harvest must be submitted to the Panamanian forestry agency.  Most of the land available for planting high valued timber species has disappeared because of urbanization. The remaining available land has poor quality soils and is not sufficient for planting.  

The wholesalers interviewed in both countries had 100-500 employees on average, with one wholesaler with over 2,000 employees.  The wholesalers’ wood product lines currently consists of cabinets, flooring, furniture, millwork, and home improvement items.  Their customer, base which primarily uses insect and decay resistant cement and steel, consists of retailers, homeowners, contractors, and government offices.  Historically these items have been preferred building materials because of the hot and humid climate in Central America, but cement and steel require a lot of energy and produce large amounts of carbon dioxide and other pollutants during the manufacturing process.  The Costa Rican Government  has mandated that the country be carbon neutral by 2021; this gives wood product companies an opportunity to expand more into building construction.  

Figure 3. Pine lumber supply at a Costa Rican forest products wholesaler. Author’s Photo

The companies interviewed largely import pressure treated lumber, softwood lumber (10-15 containers/month), panels (1-10 containers/month), hardwood veneer (1-10 containers/month), flooring, and furniture/parts (1-10 containers/month).  Some of the wood product wholesalers conducted business with wood product brokers in the U.S. for softwood lumber (Southern yellow pine) and panels, but all of the buyers were familiar with Southern yellow pine lumber from the United States. The companies in Panama and Costa Rica primarily import softwood lumber from Chile (See Figure 3), Brazil, Honduras, and Uruguay, which is dried to 12-14% moisture content.  Imported panel products consist of oriented strand board (OSB), plywood, medium-density fiberboard (MDF), particle board, and B-B plywood; Oiled face & Edge-Sealed edges (BBOES) plyform. 

The majority of the buyers were familiar with Appalachian hardwoods and they were willing to import them if they were competitively priced with native tropical hardwood species in the region. Appalachian hardwoods can be used in doors, mouldings, cabinets, furniture, flooring and ceiling panels.  Flooring and furniture are primarily manufactured by using dark reddish species, therefore, black cherry (Prunis serotina) and black walnut (Juglans nigra) from the Appalachian region could be a substitute for the tropical hardwood species currently used, such as Guanacaste (Enterolobium cyclocarpum) (Figure 4). 

Figure 3. Comparison between Appalachian hardwood species to a native tropical species. From left to right: Guanacaste (Enterolobium cyclocarpum), Black Cherry (Prunus serotina), Black Walnut (Juglans nigra)
Transportation issues were addressed during the interviews.  Wholesalers reported that logistics was not a problem when importing wood products.  Products arriving to Panama primarily enter the country at the Panama City port.  In Costa Rica, the products can arrive at two locations: Caldera Port, Puntarenas on the Pacific coast and Port of Limón on the Caribbean coast. 
Conclusions

This research supports the claim that United States forest product companies have not put enough effort into entering the forest product market in Panama and Costa Rica. Main conclusions indicate that the majority of the general public is unfamiliar with the properties and uses of wood as a building material since steel and cement are the currently preferred building materials.  Forests in Panama and Costa Rica are not being harvested and the industry lacks support from the government, causing a reduction in the amount of raw material and production. An outside source of wood is needed to meet the needs of a growing region infrastructure.  

References 

Fallas, H. 2008.  Country Caters to Tourists with Tight Supply of Rooms.  La Nacion. Section of Economy. March 10. Available at: http://www.nacion.com 

Montagnini, F. et al. 2003.  Enviornmental Services and Productivity of Native Species Plantations in Central America.  XII World Forestry Congress, 2003.  Quebec City, Canada. 

Munoz, M. 2007. Menejo Forestal en Panama. La Presna.  November 25, 2007. Available at  http://biblioteca.presna.com/contenido/2007/11/25/25-portada1.html 

Quesada, H., R. L. Smith & J. Stopha 2009.  Market Opportunities for Virginia’s Wood Products in Central America.  Federal-State Marketing Improvement Program Grant. 

Rogers, N. 2009.  Tourism Grows Despite Worldwide Slump. The Nica Times. July 24-30, 2009.  Available at:http://www.nicatimes.net/nicaarchive/2009_07/0724091.htm       

Salamone A. 2000.  Opportunities in Central America.  Available at:            http://www.fas.usda.gov/ffpd/wood-circulars/jun00/camerica.pdf 

Schieber, B. 2009.  Guatemala at The International Tourism Trade Fair, FITUR 09. The Guatemala Times. January 28, 2009. 

Virginia Department of Agriculture and Consumer Services (VDACS), 2008. Virginia Forest Products Export News. Fall-Winter 2008.  Available at: http://www.vdacs.virginia.gov/international/pdf/forestnews.pdf 

Virginia Economic Development Partnership (VEDP), 2008.  Wood Products In Virginia.  Available at: www.yesvirginia.org 

World Bank, 2010.  Country Data Profile. The World Bank Group.  Available at: http://ddp-ext.worldbank.org/