The Frascati Manual indicates that Research and Development (R&D) expenditures in The United States of America (USA) are classified by the North American Industry Classification System (NAICS) and under three research categories. These three categories are: (1)Basic research that covers all the experimental and theoretical work developing knowledge for the foundation of a topic but with no defined application or use; (2) Applied research which is knowledge developed through original investigation aiming an objective; and (3) Experimental development that is created under a systematic work, developing knowledge or using existing knowledge, targeting improvement of current material, products, process and services or the development new materials, products, processes and services. In 2008, R&D expenditures in the USA were approximately $397 billion. Out this total, basic research accounts for 17% ($69.15 billion), applied research for 23% ($88.59 billion), and development for about 60% ($239.89 billion) according to the National Science Foundation (NSF 2010).
At the industry level, these expenditures were mostly performed by the pharmaceuticals/medicines (NAICS code 3254), the semiconductor/other electronic components (NAICS code 3344), the communications equipment (NAICS code 3342), and Software publishers (NAICS code 5112) sectors. This last sector has the highest ratio of R&D as a share of sales. Table 1 shows the data corresponding to R&D expenses and sales for these industries (Wolfe, 2010).
Table 1. R&D expenses as a share of sales. (Wolfe, 2010)
| Industry (NAICS code) | Sales worldwide ($ million) | R&D expenditure ($ million) | R&D as a share of sales |
| Semiconductor/other electronic components (3344) | 192,258 | 28,812 | 15% |
| Pharmaceutical/medicines (3254) | 529,601 | 69,516 | 13% |
| Communication equipments (3342) | 132,307 | 14,987 | 11% |
| Software publishers (5112) | 317,084 | 35070 | 11% |
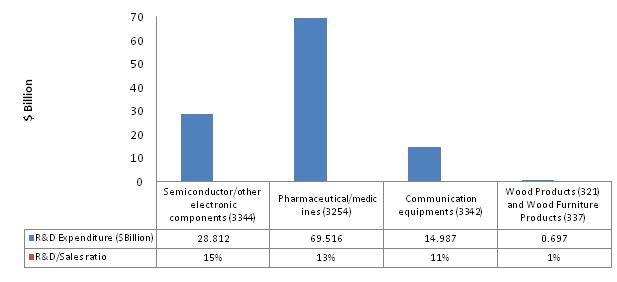
In the wood products industry data show that the primary wood products (NAICS code 321) and the secondary wood products sector (NAICS code 337) spent together $0.697 billion in 2008, which is less than 1% of total sales, similar to what happened in 2006 in this industry (Wolfe 2010). As a comparison, the overall ratio of R&D expenses to sales in the manufacturing industry in US was approximately 4% in 2006. This might be indicating that perhaps wood products industries need to increase their investments in R&D activities in order to increase their sales. Figure 1 shows a comparative chart of R&D expenditures as a ratio of sales for some industries including wood products.

This situation shown in Figure 1 might be an indication that R&D expenditures (as a measure of Innovation) must could be defined as a sustainable growth strategy for the Wood Products Industry if the business wants to remain competitive and profitable.
References:
National Science Board. (2010). Research and development: essential foundations for U.S. competitiveness in a global economy. A companion to Science and Engineering Indicators – 2008. NSF.
Wolfe, R. (2010). U.S. Businesses Report 2008 Worldwide R&D expense of $330 billion: findings from new NSF survey. NSF. 10, 322
