
Survey research is an observational study mode in the social sciences that gathers information from respondents through the application of a questionnaire, with the purpose of making inferences about the population respondents belong to (Babbie, 2010). This method is usually preferred when the unit of analysis is the individual person; however, it is also widely used for studies that involve groups or organizations, such as markets or companies. Surveys are observational rather than experimental because their intent is to capture information without influencing the unit of analysis. Survey research is an effective way to collect data because the observation can be carried out indirectly – the researcher does not need to be physically with the respondents, instead, it may be self-administered. Additionally, only a sample of the total population can be observed to make inferences about the whole, as long as the sample is randomly selected. It is considered as a quantitative method: its purpose is to make inferences about the population the respondents belong to. Here, the respondent is the individual person that provides data by answering the survey questionnaire.
Goals of Research Survey
Survey researchers may have one or multiple goals to conduct a study. According to the nature of these goals, studies can be classified as exploratory, descriptive, explanatory or a combination of these. Exploratory studies are conducted when the researcher is interested in increasing his understanding of the relevance of a topic to a given population, or to assess the feasibility of conducting a larger study. Descriptive surveys are designed to describe the characteristics and behaviors of the population. Explanatory surveys area carried out when there is an interest in understanding why things happen (Vaske, 2008).
In order to achieve this objectives, survey researchers generally need to complete following phases:
- Specifying the research questions and hypothesis
- Design the survey and the implementation plan (i.e. survey methodology)
- Collect and analyze data
Specifying the research questions and hypothesis
Survey research, as many other types of research starts with the definition of a problem. Once a problem statement has been clearly defined, it is the work of the researcher to look for theories that explain, in general terms, the phenomenon studied. With some background knowledge of previous research work and the theory developed on the subject, the researcher establishes a set of hypotheses for the problem – testable expectations on how the phenomenon of interest works according to theory. The research questions (Alford, 1998) are similar to hypothesis but are formulated in a question format. The purpose of research questions is help with the design of a research that will build an argument based on theory and experimental data, and make inferences about the nature of the phenomenon of interest. With all this knowledge at hand, the researcher should be able to create a theoretical framework to guide the design our survey.
Design the survey and the implementation plan (i.e. survey methodology)
Designing a survey involves crafting questions that will help the researcher with measuring the relation between variables as stated in the theoretical framework and or describing the situation being studied (Dillman, Smyth, & Christian, 2009).
Dillman et al. (2009) indicate that there is a difference between a list of questions and survey questionnaire. In the process of answering a survey, respondents extract information not only from the wording of questions, but from the order in which they are arranged, the symbols and spaces provided to enter the responses, the colors used, the headings of sections, the scales, the typography, and in general, of the visual design. In this context, a list of questions if the first step in designing a survey, but not the only one.
To craft survey questions, the researcher needs to decide what format is the most appropriate to collect the information he or she is looking for. At this point it is important to realize that questionnaires are not only collections of questions, but also of statements upon which respondents are asked whether they agree or disagree. Indexes and scales have been developed to measure the degree or approval, importance, frequency, etc. (e.g. Likert’s Index).
When designing questions, researchers may follow two different approaches: open-ended or close ended questions. Open-ended questions allow the respondents to provide their own answers, whereas in close-ended questions the responded is asked to choose his or her answers for a list of alternatives. Open-ended questions area ideal to ask in-depth information about the topic of the question, but other (less descriptive) alternatives of open-ended questions are also used to ask for numerical values or for lists of items. The answers to open-ended questions need to be coded so that quantitative techniques can be used for the analysis. Closed-ended questions can be divided in two categories: nominal and ordinal. Nominal close-ended questions provide the respondent with a list of alternatives that don’t follow any natural ordering, whereas ordinal close-ended do. Both categories may be single or multiple answer (Babbie, 2010).
In order to migrate from a “list of questions” to a questionnaire, three fundamental aspects of design need to be addressed: technology, ordering and visual design. The most common technologies used currently in survey design are mail survey, on-line survey and phone-survey. Each one of these categories presents its variations and implementation challenges, the selection of the technology dependents largely depends on the feasibility to reach all members of population sample (Dillman et al., 2009).
Additionally of the technology, the questionnaire should be organized similar to a conversation, in accordance with societal norms (Dillman et al., 2009). In general, conversations follow a logical order where general questions that apply to nearly all respondents go first; those asking for sensitive information a left for the end, and the main body of questions is grouped together by topic.
When respondents begin to answer a questionnaire, they are also learning how it works. In general, the way people process visual information can be divided in into three stages. First comes the understanding of the general layout of the page or screen, then the individual begins understands the way information is organized within the layout, and finally the individual’s attention is focused on the task at hand – answering the questions. There are multiple aspects of the visual design of a questionnaire that can be manipulated to make it more friendly and professional, in such a way that increases the response rate; but what is key is to establish consistency in the visual presentation of questions across pages and screens, so that respondents won’t need to re-learn how to the questionnaire works multiple times.
Implementing a survey involves more than just sending the questionnaire, it also requires looking for tactics to motivate the respondents to see the potential value of the research project and participate. Developing a proper communication strategy is key to engage participants in the project. For the mail survey, Dillman recommends a five steps process that involves: a) pre-notice letter, b) questionnaire mailing (with cover letter), c) thank you post card, d) replacement questionnaire and e) a final contact notice. A similar strategy can be develop for other survey modes.
Collect and analyze data
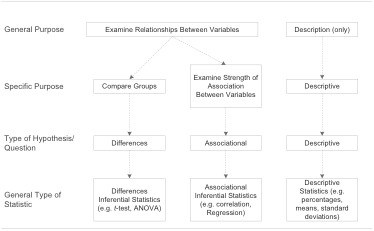
Once the responses have been received, the researchers needs to learn from the data to increase his or her understanding about the sample and the population; that is why statistics are used. There are two main areas of statistical analysis that can be performed on the data: descriptive and inferential. Descriptive statistics are used to determine the characteristics of the sample and relationship between variables within the sample, whereas inferential statistics address the study of the characteristics of the population and the relation of variables at such level. There are multiple statistical procedures for making inferences either to single or multiple variables, figure 1 provides an overview of them.
Conclusions
Survey research is a valuable tool in business since it provides with information about organizations and their contexts to make better decisions. It is important to understand that multiple aspects of the design and implementation of a survey have a posterior impact on the quality of the data. Therefore, careful study of the different phases involved in the process is an important area of concern for researchers.
References
Alford, R. R. (1998). The Craft of Inquiry: Theories, Methods, Evidence. New York: Oxford University Press
Babbie, E. R. (2010). The Practice of Social Research. Belmont, Calif: Wadsworth Cengage.
Dillman, D. A., Smyth, J. D., & Christian, L. M. (2009). Internet, Mail, and Mixed-Mode Surveys: The Tailored Design Method. Hoboken, N.J: Wiley & Sons.
Vaske, J. J. (2008). Survey Research and Analysis: Applications in Parks, Recreation and Human Dimensions: Venture Publishing State College, PA.