
By Juan Gonzalez, email jjgoco02@vt.edu
Thermally modified wood (TM) wood products have been available in the United States since Westwood Corp started exhibiting thermal-treated wood products at fairs, and companies such as Jartek Inc. and Stellac Inc, started to produce TM wood products (Sandberg et al., 2016). Initially, the production of TM wood products was intended as an alternative to substitute chromate copper arsenate treatments. Since the United States started creating restrictions regarding the use of toxic substances on their wood products many companies have begun to incorporate the production of TM wood products. According to Sandberg (2016) by 2012 there were already ten manufacturers across the US working producing thermally modified lumber.
The goal of this study was to evaluate the variability of the physical and mechanical properties of two thermally treated species currently manufactured in North America. One of the limitations that TM wood is facing is the lack of domestic manufacturers currently producing this product and the use of different equipment and treatments (schedules) which may create variability in final product performance.
TW treated yellow poplar (Liriodendron tulipifera) and red maple (Acer rubrum) were acquired from three different commercial sources in North America to conduct bending and strength (MOE/MOR) tests by following the ASTM D143 standard. Each company provided 14 samples from each species. Samples were conditioned at 20°C and relative humidity of 65% until they reached an equilibrium of moisture content before testing. ANOVA was then used to determine and compare the variability within and between each companies’ processes.
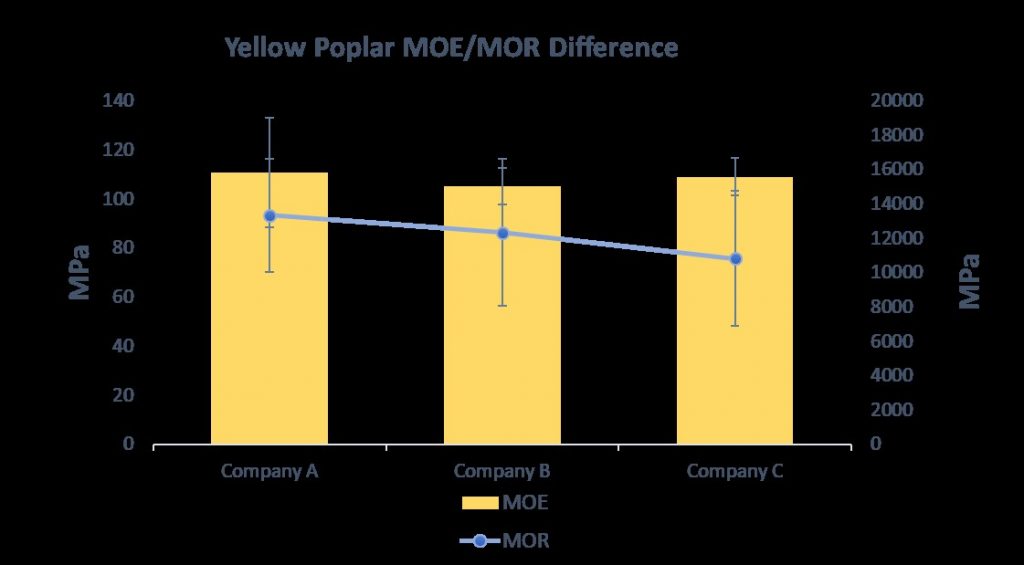
Figure 1. Yellow Poplar MOE/MOR Difference
Figure 1 shows a graph with the results obtained for both MOE and MOR for yellow poplar. The chart shows how similar the results from the three companies were. After running an ANOVA, the results displayed with 95% confidence intervals have they have equal means with a P-Values of 0.089 and 0.655 respectively.
Table 1. Red Maple MOE/MOR results.
| Factor | N | Mean (MPa) | Standard Deviation | Group |
| MOE A | 14 | 18,282 | 3,198 | A |
| MOE B | 14 | 17,352 | 1,075 | A B |
| MOE C | 14 | 16,310 | 1,100 | B |
The MOE/MOR values across the three companies share the mean with 95% confidence intervals and P-Values of 0.089 and 0.05. But Tukey’s comparison method displays that the MOE values from company B and C are different, and A shares the values between them. Statistically they might be different, but percentage-wise for the industry the difference is not that big.
Bibliography
- Sandberg, D., & Kutnar, A. (2016). Thermally modified timber: recent developments in Europe and North America. Wood and Fiber Science, 48(1), 28-39.
- UNECE/FAO. (2013). UNECE/FAO Forest Products Annual Market Review, United Nations Economic Commission for Europe, Food and Agriculture Organization of the United Nations, New York, and Geneva.