Gaurav Kakkar, email at kakkarg@vt.edu
A value stream of a product is all the actions associated with conversion of supplier filled raw materials to consumable finished product. It includes all the internal activities that must be performed within each tier of supply chain to make the final product (Rich, et al. 2006). Value Stream Mapping (VSM) is a portfolio of techniques to analyze this flow of material and information in a production system from door to door operations. The exercise includes mapping all the processes involving flow of information or materials in the company. It is suitable tool to facilitate decision makers, operators to visualize and analyze the operations to recognize waste and identify its causes. Thus it can be used to view and diagnose current status and develop strategies for future improvements making it an effective method for illustrating and redesigning the value streams. The method originates from the Toyota Production System (Ono 1988) and consists of two main phases: value stream analysis and value stream design. The first phase aims at visualizing the current value stream and the second aims at identifying the wastes.
There are three types of operations being undertaken at a facility (Monden 1993):
1. Non-value adding (NVA)
2. Necessary but non-vale adding (NNVA) and
3. Value Adding (VA)
NVA activities like waiting times, double handling etc. are pure wastes and involves unnecessary actions. NNVA, on the other hand are wasteful but are necessary to support the value adding operations and making of the product. It is impossible to eliminate them completely. The value adding operations, VA involves conversion of processing of raw materials or semi-finished products. VSM helps in categorizing the production operations into these categories and obtain a complete systemic view. Toyota Production System (Ono 1988) identified following 7 wastes which prevents a system a go leaner:
1. Overproduction
2. Waiting
3. Transport
4. Inappropriate processing
5. Unnecessary Inventory
6. Unnecessary motion
7. Defects
Hines and Rich (1997) and compiled seven tools of value stream mapping that can be used to target each of the above mentioned seven manufacturing wastes. Each of these tools have varying application in identifying the wastes and thus can be used in combination with each other. Below is the brief introduction of these tools.
1. Process Activity mapping: In this mapping methodology, a vital piece of raw material is followed in the entire production process. Those steps in conversion process that add value for which the consumer would be willing to pay are called Operations and rest non value adding are classified as waste. The map can be used to identify value adding fraction of total time that the material spends in the production system.
2. Supply Chain Responsiveness matrix: This mapping technique uses cumulative inventory in days at every stage of the production process and plots it against the time to plan and move from one stage to another. The resultant graph can be used to identify problems in material flow.
3. Product Variety funnel: This methodology is applicable to production systems involving standard raw materials and a variety of final product types. By tracking the production process, the management can identify the point up to which the manufacturing stays generic without differentiation. Maintaining a generic stock buffer till the point allows that allows rapid expansion and finish products to fulfill consumer orders.
4. Quality Filter mapping: This mapping technique highlights waste generated in each stage of production. This waste can be scrapped product, rework or service defects. Such a mapping can facilitate managers to focus on stages to make quality improvements and eliminate waste.
5. Forrester Effect mapping: This mapping highlights delays with scheduling and actual production with respect to demand fulfillment. It compares demand forecast, actual shipments, launch of production batches and ordering of raw materials in a line graph. A perfectly lean system would have a series of flat lines.
6. Decision Point Analysis: This is a great tool to identify ‘make to order’ points in a production system. It uses the total production times through the factory and the waiting time the customer would accept. It is mostly applicable where the aim is to reduce lead time for customers.
7. Overall Structure maps: This tool is different from the other mapping tools as it shows the number of suppliers for each stage of production, companies engaged in distribution channels of the firm and the value each one of them adds to the final product.
While none of these tools provides a sufficient and robust solution to all of the management problems, an optimal combination of them can be used to address the key issues. Table 1 shows the application and level of usefulness of these tools to eliminate each of the seven wastes and characterize the system.
Table 1. Value stream mapping tools and their application
| Mapping tools | |||||||
| Waste/structure | Process activity mapping | Supply chain response matrix | Production variety funnel | Quality filter mapping | Demand amplification mapping | Decision point analysis | Physical structure
Volume and value |
| Overproduction | L | M | L | M | M | ||
| Waiting | H | H | L | M | M | ||
| Transport | H | L | |||||
| Inappropriate processing | H | M | L | ||||
| Unnecessary inventory | M | H | M | L | H | M | L |
| Unnecessary motion | H | L | |||||
| Defects | L | H | |||||
| Overall Structure | L | L | M | L | H | M | H |
| Notes: H= High correlation and usefulness
M= Medium correlation and usefulness L= Low correlation and usefulness Source: (Hines and Rich 1997) |
|||||||
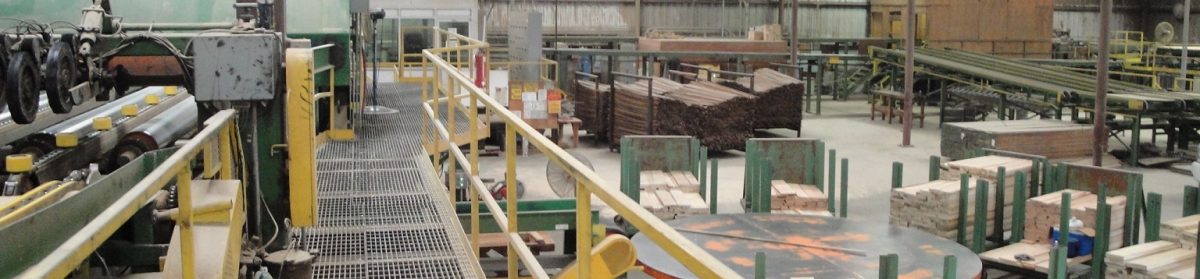
The process targets lean, agile and pull controlled value chains with shorter lead times and reduced inventories (Rother 2003, Nash and Poling 2011). The research team at SIM is extending this knowledge to the secondary forest products industry in support their attempts to go lean.
References
- Hines, Peter, and Nick Rich. 1997. “The seven value stream mapping tools.” International Journals of Operations and Production 46-64.
- Monden, Y. 1993. Toyota Production System: An Inegrated Approach to Just-in-Time. 2nd. Cambridge, MA: Productivity Press.
- Nash, Mark A, and Sheila R Poling. 2011. Mapping the Total Value Stream. CRC Press.
Ono, T. Toyota. 1988. Production System: Beyond large-Scale Production . Productivity Press. - Rich, Nick, Nicola Bateman, Ann Esain, Lynn Massey, and Donna Samuel. 2006. Lean Evolution: Lessons from the Workplace. New York: Campridge University Press.
- Rother, M. 2003. Learning to See: Value Stream Mapping to Add Value and Eliminate Muda. Lean Enterprise Institute.