
By Paula Fallas, dfpaula@vt.edu
In today’s conditions it is easy to think that different elements across supply chain cooperate to share information, that can potentially increase efficiency throughout the value stream. This should be true especially provided that technology can aid in such communications. Even though there is a wide range of information regarding the consequences of lack of cooperation across a supply chain it isn’t practiced regularly.
In the wood fiber supply chain, a Supplier/Consumer Relationship study conducted in 2012 showed that suppliers throughout the United States experienced a lack of cooperation between them and the customer mills. This lack of cooperation can be associated to information sharing. For example, in the Mid-South region, “suppliers cite a significant lack of joint planning that could be beneficial to both their business and the customer mills attempting to reduce costs” (Taylor, 2012). Similarly, the Southeastern region reported cooperation issues such as the lack of long-term wood orders (Taylor, 2012). Both of these concerns reflect that planning or effective demand forecasting are restricted due to the industry’s characterized business practices. The issues stated above reflect just a minimum reality of challenges to overcome.
To demonstrate the power of information sharing, it is of interest to understand and determine what the bullwhip effect is, what contributes to this effect and what are ways to decrease it.
Figure 1 shows how variability in orders fluctuate depending on each element of the supply chain. Across time both suppliers and retailers observed that even if customer demand for certain products presents low variation, orders increase in quantity and in variation moving up throughout the supply chain. The increase in variability migrating throughout each link in a supply chain is called the bullwhip effect (Simchi-Levi, Kaminsky and Simchi-Levi, 2015).

Source: (Simchi-Levi, Kaminsky and Simchi-Levi, 2015)
Table 1 describes the main factors contributing to the bullwhip effect.
Table 1. Main Factors contributing to the increase in variability
|
Demand Forecasting |
Traditional inventory management techniques usually have fluctuations. Most of these techniques depend on estimates of the mean and standard deviation which depend on the quantity of data observed. |
|
Lead Time |
For example, in both safety stocks and base stock levels, the lead time and the review period are taken into consideration. This implies that a variation in lead time will in effect increase variability. |
|
Batch Ordering |
The effect of batch ordering can be easily explained through elements of the supply chain that are taking advantage of economies of scale. For example if there is a discounted price of transportation a batch will be ordered, increasing holding cost. This would be followed by a longer period without ordering. This increases variability. |
|
Price Fluctuation |
Similar to batch ordering price fluctuation stimulates stocking up when prices are low. Forward buying is used to imply that retailers purchase large quantities and small quantities depending on market conditions. |
|
Inflated Orders |
This is observed when the product is suspected to be in short supply by retailers and distributors. This generates unbalanced orders, when the period is over the standard orders are in place again. |
Source: (Simchi-Levi, Kaminsky and Simchi-Levi, 2015)
The bullwhip effect can also be explained as a coordination problem between different elements of a supply chain (Moyaux, Chaib-draa and D’Amours, 2003). Therefore, how can the interactions between autonomous companies affect the bullwhip effect? More specifically how can a centralized supply chain or a decentralized supply chain affect this phenomen? A centralized supply chain is referred as a single decision maker and a decentralized is several decision makers, with different intents, interests, and information. A simplified example of Simchi-Levi et al. (2015) clarifies this question.
Considering a supply chain with a single retailer and manufacturer, where a periodic review inventory policy is implemented with a fixed lead time and a review period of 1. The order-up-to point in period t is calculated below from the demand observed, where z is a statistically obtained safety factor.
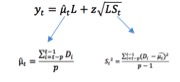
Source: (Simchi-Levi, Kaminsky and Simchi-Levi, 2015)
In Figure 2 the daily consumer demand and standard deviation are estimated using the moving average forecasting technique (the arrows point to both of these parameters in Figure 2). Each period (p) for which these parameters are calculated depends upon previous periods. Therefore, for each different period of time (t) the average and standard deviation are re-calculated. The consequence is each period having a different order up to level, therefore a variation in inventory is present (Simchi-Levi et al., 2015).
This model demonstrates that by increasing the lead-time (L) and decreasing p the bullwhip effect rises, under the conditions previously mentioned. In the model below the variance of customer demand is which is divided by variance of orders of a retailer (placed to a manufacturer).
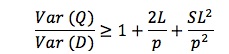
Source: (Simchi-Levi, Kaminsky and Simchi-Levi, 2015)
With the information stated above it is intuitive to realize that without information sharing or cooperation within a supply chain the bullwhip effect increases. The manufacturer’s demand is calculated based on each previous period’s customer orders which are obtained from the retailer. These orders defer from the real customer demand. Therefore, variability can increase across the supply chain. When the demand information is known throughout each stage of the supply chain the forecasts become more accurate (Simchi-Levi et al., 2015).
Achieving coordination in a supply chain is not an easy task, and business practices in the wood industry make it more evident. Studies have been conducted in the forest supply chain to reduce the bullwhip effect. A coordination mechanism was investigated by Moyaux et al. (2013) which utilized tokens (communication resource) to communicate between autonomous agents. Figure 2 illustrates the model of the forest supply chain used in this study.

Source: (Moyaux, T., Chaib-draa, B. and D’Amours, S, 2003).
This is based on the principle that there can be two different orders communicated, using two different tokens. The first being the real time demand and the second to manage fluctuation inside the supply chain (the difference of products required by each company to maintain its inventory and the real demand). After multiple experiments a centralized supply chain with the use of tokens gives the best result, out of multiple combinations of experiments, considering total inventories, standard deviation of orders and total backorders. In general, the token based ordering is better than others Moyaux et al. (2013).
This research brings hope that better cooperation can be achieved even if full cooperation (centralized supply chain) cannot be obtained in challenging industries such as the wood fiber supply industry. Parameters that affect the variation such as lead time and forecasting methods must be improved through more cooperative relationships throughout the companies. There is still a considerable amount of work in order to achieve optimal or improved supply chains, but strategic partnerships between members is a crucial beginning.
Bibliography
- Moyaux, T., Chaib-draa, B. and D’Amours, S. (2003). Multi-Agent coordination based on tokens. Proceedings of the second international joint conference on Autonomous agents and multiagent systems – AAMAS ’03.
- Simchi-Levi, D., Kaminsky, P. and Simchi-Levi, E. (2015). Designing and managing the supply chain. 1st ed. Boston: McGraw-Hill/Irwin.
- Taylor, D. (2012). Mid-South Region Report. Supplier/Consumer Relationship Study. [online] Wood Supply Research Institute, p.6. Available at: http://www.wsri.org/tech-papers/MidSouthReport.pdf [Accessed 28 Apr. 2017].
- Taylor, D. (2012). Southeast Region Report. Supplier/Consumer Relationship Study. [online] Wood Supply Research Institute, p.6. Available at: http://www.wsri.org/tech-papers/SoutheastReport.pdf [Accessed 28 Apr. 2017].