Shawn Crawford, MS Candidate. shawn88@vt.edu
The purpose of this research update is to present some of the most significant energy reduction practices in the forest products sector. This research update is currently using secondary sources, lit reviews, to discover popular energy saving practices within the forest products industry. The update will provide industry examples of best energy management practices and how these practices should be applied throughout the forest products industry.

In the U.S., industrial energy demand accounts for 26% of total energy consumption supporting the statement that the U.S. is a highly industrialized country (EIA, 2010). 14% of the industrial energy demand is supplied by electricity making electrical energy demand a large source to focus on potential reduction (EIA, 2010). The forest products industry makes up a small portion of the U.S. industry however; with increasing prices on electrical demand electricity is a contemporary topic for savings correlated with manufacturing cost. Electricity prices have increased by 1.24 cents per kilowatthour from 2005 to 2009 (EIA, 2010). Energy prices are predicted to steadily increase in the future. Coal accounts for 45% of total sources used for electricity however; coal stocks have decreased between May 2010 and May 2011 by 8.6 % which is a higher percentage than expected (EIA, 2010).
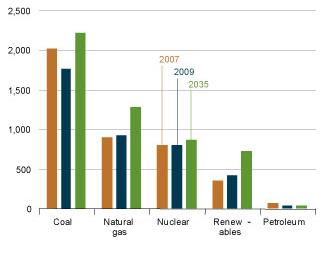
Figure1 shows the predicted increase in demand for coal and natural gas as a source of fuel for electrical generation. However; due to decreased stocks in coal and natural gas, electricity prices are predicted to rise. With predicted rises in electrical prices this makes electricity cost within a manufacturing facility an important element to analyze.
Energy savings opportunities through the implementation of “lean” manufacturing principles applied to different processes within the system can be quantified. When applying lean manufacturing principles, the focus is on adding value from the perspective of the consumer. Eliminating or trimming waste from the process materializes from the idea of value adding and non-value adding through the eyes of the consumer. Waste within a process has a significant impact on manufacturing cost, where energy utilization is one predominate cost. Dominant manufacturing costs in the form of electricity consist of compressed air, inefficient motors, and lighting.

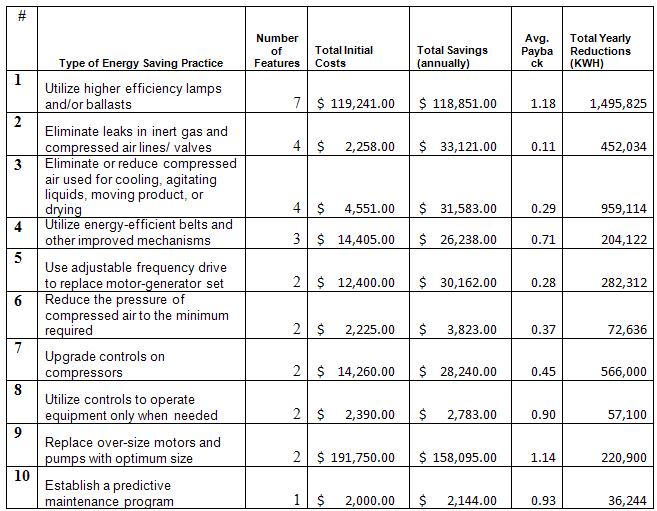
Table 1 shows top 10 electrical energy saving practices in the forest products industry. Rankings are based on practices with a 2 year or less payback period. Table 1 is derived from the Industrial Assessment Center Database (IACD), which provides information on all public assessments and recommendation projects for different industries (DOE, 2010). Individual companies are not identified to uphold non-disclosure requirements, however; the information is aggregated for each industry sector. This data is useful when comparing different sectors of the industry or benchmarking an individual business within a particular sector. Using data from the IACD, Table 1 focuses on the top 10 most common energy saving practices within the forest products sector. A financial payback analysis provides a benchmarking tool to determine the popularity of different energy saving practices.
Lighting, due to its relative ease of restoration, is a common suggested repair associated with electrical energy savings. Therefore improvements in lighting are commonly suggested energy saving practices which is shown as the top ranked practice in Table 1. A common waste of lighting is inappropriate design of lighting systems. An example of inappropriate design being lights placed over areas that rarely require lighting. Lights used in a more efficient manner eliminate or reduce inappropriate lighting systems and therefore lead to significant energy savings.
Air compressors are needed in the forest products industry to support many different systems. This need creates a complex network of piping making it difficult to implement improvements on the system. Air compressors are commonly used in the forest products industry for opening up kiln vents, cleaning off machines, and powering tools. However, it is easy to identify energy waste from an air compressor. Anytime there is a significant spike in energy usage, it is most likely correlated with an air compressor problem such as a leak or being air supply turned on when not needed. Table 1 shows the shared aims of the forest products industry in reducing energy waste caused by air compressor leaks. Individual leaks are difficult to locate requiring time and effort to fix. Although leaks are difficult to find, repairing a leak can lead to significant energy savings. As shown in table 1, fixing and constantly maintaining air compressors contribute to a fast payback period compared to other energy saving practices.
Energy waste is also associated with inefficient or ineffective motors, pumps, and compressors. Inefficient motors are common quick repairs further supported by Table 1 showing that out of the top 10 energy saving practices in the forest products industry, optimizing motor power systems is the fourth most common. Replacing inefficient motors has the highest upfront cost as shown in Table 1, however; there are many other less costly practices available to use motors and related mechanical systems more effectively. While replacing motors and pumps with up-to-date energy efficient technologies projects significant savings, proper maintenance and optimum use of such systems oftentimes provide similar energy savings with minimum initial cost.
“Lean” manufacturing principles which are proven effective at identifying and eliminating waste, if used correctly, can become an effective production practice to manage energy consumption. However; in order to make a production process more energy efficient, benchmarking is necessary. Detailed metrics of energy consumption
References
- United States Department of Energy (DOE). Industrial Assessment Centers Database. Rutgers CAES, 2011.Available at <http://iac.rutgers.edu/database/>. Last Accessed Aug. 30, 20
- U.S. Energy Information Administration (EIA). Annual Energy Outlook 2011. 2011. Available at
- <http://www.eia.gov/forecasts/aeo/MT_electric.cfm>. Last Accessed Sep. 26, 2011
- U.S. Energy Information Administration (EIA). Use of Energy in the United States Explained. 2011. Available at <http://www.eia.gov/energyexplained/index.cfm?page=us_energy_industry>. Last Accessed Sep. 13, 2011
- U.S. Energy Information Administration (EIA). Use of Electricity- Basics. 2011. Available at <http://www.eia.gov/energyexplained/index.cfm?page=electricity_use>. Last Accessed Sep. 13, 2011
- U.S. Energy Information Administration (EIA). STEO Table Browser. 2011. Available at <http://www.eia.gov/emeu/steo/pub/cf_tables/steotables.cfm?tableNumber=8&loadAction=Apply+Changes&periodType=Annual&startYear=2005&endYear=2011&startMonthChanged=false&startQuarterChanged=false&endMonthChanged=false&endQuarterChanged=false&noScroll=false>. Last Accessed Sep. 13, 2011
- U.S. Energy Information Administration (EIA). Electrical Power Monthly. 2011. Available at <http://www.eia.gov/electricity/monthly/index.cfm>. Last Accessed Sep. 13, 2011
