Petroleum (oil) is the largest U.S. primary energy consumption followed by natural gas, coal, nuclear electric power, and renewable energy (EIA, 2011). Electricity is a secondary energy sources produced by these sources. Some of the main energy consumers in the U.S. are residential, commercial, industrial, and transportation. Industry accounts for one-third of the energy used in the country, 28% of that energy comes from natural gas and 14 % comes from electricity (EIA, 2009). Electrical demand growth is projected to increase at about 1% per year through 2035, while from 2005 to 2009 cents per kilowatthour increased by 1.24 (EIA, 2009). Due to a continually increasing demand for energy sources and a limited supply of those sources, energy prices are expected to increase (EnerNoc, 2011).

Energy Management System (EMS)
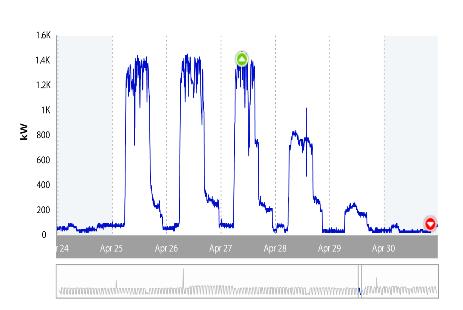
An Energy Management System or EMS provides a company constant data feedback on their energy consumption. Depending on the type of EMS, energy consumption can be tracked all the way down to 5 min intervals. The more detailed the EMS the greater potential for improvements. Imagine and EMS that provides a company’s natural gas consumption every hour as opposed to a power company providing the information monthly. Some benefits of an EMS include; being able separate consumption rates, able to identify high consuming areas, able to make daily adjustments to improve monthly bill, automated system automatically manages/adjust to improve energy inefficiencies, and able to create new process improvements to increase efficient energy use. Figure 1 shows a snapshot of an EMS.
Managing Energy and Process
Fostering innovation and creativity should be an ongoing project for managers. An EMS provides the tools for a manager to take employee innovation and put it to the test. Innovative employees provide solutions to ongoing problems associated with the business, finances, process, and product, because they are the experts at their job/task. Providing employees with real time feedback showing how their improvements have helped to save money motivates employees to continually improve. This is crucial in sustaining an atmosphere of continuous improvement.
Understand the Power Bill
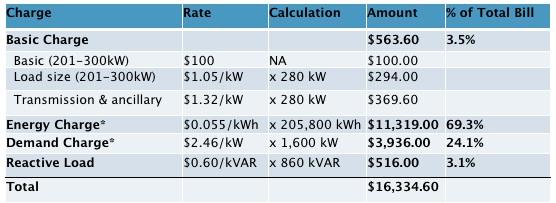
A manager of a plant should have an in depth understanding of their power bill. Figure 2 shows a potential analysis of the power bill. Being able to separate out different charges associated with a power bill affords a manager the ability to cut energy costs in different sectors. A typical electrical bill is divided into two groups;

1. Distribution Service
- Consumer Delivery Charge- cost associated with electrical meter, billing, meter reading, and equipment maintenance
- Demand Delivery Charge- cost of upkeep for wires, transformers, substations, and any other cost associated with transporting the energy to onsite location
- Tax Surcharge- power bill is subjected to state or federal tax
2. Electricity Supply Service
- Demand Supply- cost of electricity at a rate of $ per kWh
- Energy Supply- cost of generating the power
Power Factor
The power factor is important win focusing on energy inefficiencies. Power factor is the percentage of real power to reactive power a company’s motors are consuming. Real power is the amount of energy a motor is actually consuming as opposed to reactive power being the energy not being consumed and sent back. For example, a company that consumes more real power than reactive power has a higher percentage. A good power factor is usually above 95% in most industries.
Tools Provided by an EMS
As mentioned before, the benefits of an EMS effects the way a company manage their process and has a drastic impact on the power bill. Below are some specific tools an EMS offers:
Demand Response/Load Management
Demand response provides companies different options to reduce electrical consumption based on peak load cost or reliability issues from the electrical grid. Load management has the capability of managing electrical consumption at peak hours reducing electrical cost. By decreasing or shifting the amount of energy consumption at peak hours, energy cost reduces dramatically. In the suppliers view, demand response makes a customer more reliable decreasing distribution service charges.
Energy Supply Management
In energy supply management the focus is put on choosing the right supplier as well as the right billing plan for the company. Sometimes suppliers are limited, reducing the amount billing options tremendously. However, picking the right plan for a company depending on energy consumption can have drastic reductions in the power bill.
Managing Carbon Footprint
Managing Carbon Footprint keeps track of fuel consumption in transportation. Through the use of EMS software a company is able to keep track of mileage, miles per gallon, rate of fuel consumption, and make suggestion to reduce fuel consumption based on those figures.
Combined Heat and Power (CHP)
CHP provides an efficient alternative to electrical energy consumption through the use of thermal heating from a single fuel source. For the forest products industry, wood scraps could be used to generate onsite energy as electrical energy. CHP systems combine heat and electrical power into one achieving up to 50-70% electric efficiency (Energy and Environmental Affairs, 2011). Combining electrical and heating processes is extremely beneficial considering process heating and machine drive are the two of the largest consumers of energy in manufacturing (EIA, 2006).
Energy Service Companies (ESCOs)
After installing an EMS it can be exasperating trying to figure out how to use an EMS effectively. In most cases it is frustrating and time consuming trying to justify the cost of an EMS. An ESCO can quickly identify energy saving opportunities using software and experience. However, using an ESCO is recommended for companies planning for a large energy saving payback to justify the cost of an ESCO.
Application of EMS at Virginia Tech
Currently at the University of Virginia Tech, case studies are being conducted to research the benefits of an EMS specifically the impact process improvements have on energy savings. The EMS makes it possible to track energy consumption throughout the study. Energy consumption will be separated out by process and recorded in the form of a value stream map. An energy audit will be performed to compare estimated energy consumption within a process to actual (EMS) energy consumption for the overall process. Energy saving recommendations will be made based on financial analysis and current value stream map, potentially resulting in significant energy savings.
References
- Alleman, J. Understanding Your Industrial Electric Bill. Chart. Northwest Food Processors Association: Knowledge Exchange. 2010. Available at . Last Accessed Feb. 7, 201
- EnerNoc:Demand Smart. Graphic. EnerNoc, Boston, MA. 2011. Available at . Last accessed Feb. 7, 2012
- Massachusetts Government. Energy and Environmental Affairs. Energy Efficiency Management. Web. 2011. Available at . Last Accessed Feb. 7, 2012
- U.S. Department of Energy (DOE). Industrial Assessment Centers Database. Rutgers CAES, 2011.Available at . Last Accessed Aug. 30, 2011
- U.S. Energy Information Administration (EIA). Annual Energy Outlook 2011. 2011. Available at . Last Accessed Sep. 26, 2011
- U.S. Energy Information Administration (EIA). Use of Energy in the United States Explained. 2011. Available at . Last Accessed Sep. 13, 2011
- U.S. Energy Information Administration (EIA). Use of Electricity- Basics. 2011. Available at . Last Accessed Sep. 13, 2011
- U.S. Energy Information Administration (EIA). STEO Table Browser. 2011. Available at . Last Accessed Sep. 13, 2011
