Pricing optimization and demand management in the U.S. Hardwood Industry

Edgar Arias, PhD Candidate at VT. Email earias@vt.edu

As previous research shows, pricing is a key factor in the performance of a firm in international markets.  Nowadays, it is a common practice for companies to determine their prices based on cost plus a profit markup and/or market prices (Dolan, 2008).  The hardwood lumber industry usually works in a similar way.  The problem with these approaches is that they are usually based on arbitrary decisions and do not account for the risk of either setting prices to high –and therefore losing demand, or too low and leaving money on the table.  The goal of the next phase of my doctoral study is to test a pricing methodology based on the principles of Revenue Management, that have proved to be successful in increasing profits in other industries, and that may also be valuable in the hardwood lumber industry.  The focus of this phase will be centered in exporting firms because they have to deal with more challenges and complexities at the time of determining prices than those which focus on the domestic market.

Revenue Management (RM) is the discipline within Scientific Management that deals with pricing questions such as: “how much to ask?”, “when to drop the price (if at all)”, “what the asking price should be?”, “which offer to accept?” among others, towards maximizing profitability.  In other words, RM is concerned with demand-management decisions (Talluri & Van Ryzin, 2005).  In fact, RM is also known as demand management, yield management, pricing and revenue optimization, etc.

Above questions are rather old concerns in business, as old as the notion of free market itself.  But what is innovative about the RM approach is the application of principles and techniques original in Operations Research to find the right price for “every product, to every customer segment and through every channel” (Phillips, 2005).  It is based on the fact that markets are not perfect, and in those imperfections lies the opportunity to improve prices beyond what the market dictates, in such a way that profits are also improved (Ross, 2008).

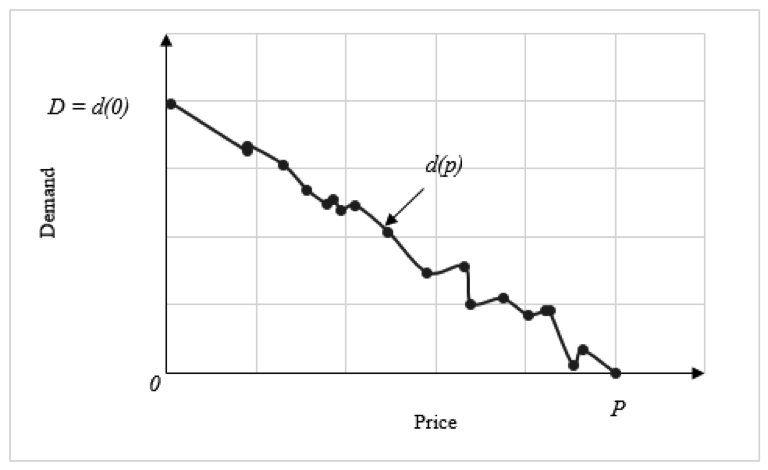
Considering that RM literature in the forest products literature is practically inexistent, we will start by studying a fundamental element of the pricing optimization process: the Price-response (P-R) function.  The P-R function (also known as curve) establishes how the demand of a product varies as a result of a change in price.  This function (Figure 1) is seller specific –companies supplying the same product to the same market will show distinct curves, and has the properties of being: non-negative, continuous, differentiable and downward sloping.  Common Price response functions are: linear, logit, S-shaped, among others (Phillips, 2005).

sim Jan 14 2

Determining the P-R function is necessary to address the basic price optimization problem which consist on maximizing the total contribution m.  Each customer order sold at a price p and with a cost c, has a unit margin equal to p-c (Phillips, 2005).  Therefore we define total contribution as following:

m(p)=(p-c)d(p)

In general the total contribution function (Figure 2) is concave, with an apex located at the point where the first derivate equals zero.  In other words, the point is where total contribution is maximized and the price is optimal (p*).

sim Jan 14 1

This simple model grows in complexity as we incorporate elements such as supply constraints and price differentiation by regions.  In this study, we will analyze historic sales data in order to determine optimum pricing values for each product in each geographic region, which will serve the sales and marketing groups in negotiating with customers abroad in a lumber supply-constrained scenario.  In the process, we will map the path that follows from base prices, through invoice prices to pocket prices (Marn & Rosiello, 2008) –what companies actually charge –and determine why companies sometimes make less money per order than the market.  In other words, we will look for potential leakages in revenue and opportunities to fix them.

References

  • Dolan, R. J. (2008). How Do You Know When the Price is Right? Harvard business review on pricing (pp. 1-26). Boston: Harvard Business School Pub.
  • Marn, M. V., & Rosiello, R. L. (2008). Managing Price, Gaining Profit Harvard business review on pricing (pp. 45-74). Boston: Harvard Business School Pub.
  • Phillips, R. L. (2005). Pricing and revenue optimization. Stanford, Calif: Stanford Business Books.
  • Ross, E. B. (2008). Making Money with Proactive Pricing Harvard business review on pricing (pp. 171-200). Boston: Harvard Business School Pub.
  • Talluri, K. T., & Van Ryzin, G. (2005). The theory and practice of revenue management (Vol. 68). New York, NY: Springer.

RESEARCH BRIEF: Questionnaire; Step by Step

by Melissa Brenes-Bastos, mbrenes@vt.edu

Developing questionnaires had been one difficult task for students around the world, according to Thomas (1999). Developing a survey became an easy process if some steps are followed: step 1: Planning, step 1: Developing the survey, step 3: Obtaining the respondents, step 4: Preparing for data collection, step 5: Collecting the survey data and step 6: Summarizing the survey data.

www.stencil-science.edu

Step 1, 2 and 3 refers to the success on the project by planning and considering all the elements included as part of the questionnaire, creating the tool that combines all the items necessary for the research in a way that is easy for the respondent and get the sample or the list of respondents that will participate in the research, respectively. (Thomas, 1999)

One of the most important problems in survey research is the nonresponse, which occurs when one of the samples does not respond to the survey. (Stoop, Billiet, Koch & Fitgerald, 2010). Reducing the nonresponse rate is not an easy task, but improving on pretesting and evaluation of questionnaires might help on that mission, that specifically refers to Step 4 of the developing of a questionnaire. Preparations for data collection include pilot testing, which can be develop by many different methods, but basically it includes the process of giving your survey to persons who represent the respondent and then ask them to provide you information about the questionnaire (Where any items unclear? Were the directions clear?, etc.) (Thomas, 1999)

Step 5; collecting the Survey Data, can be better explain by Fowler Jr. (1993), which mentions that a reasonable sequence of events that such happen after sending the first questionnaire are: “(1) About 10 days after the initial mailing, mail all respondents a reminder card, emphasizing the importance of the study and of a high rate of response, (2) About 10 days after the postcard is mailed, mail the remaining nonrespodents a letter again emphasizing the importance of a high rate return and including another questionnaire for those who threw the fist one away and (3) if the response rate is still mot satisfactory, probably the best next step is to call nonrespondents on the telephone”.

And finally Fink & Kosecoff (1985) mention that Step 6; summarizing the survey data, cover basic things such as: 1-Type of survey (interview, self-administered questionnaires, etc.) 2-Date of survey, 3-Sample size and response rate, and 4-Other explanation (sample size, response rate, reliability, etc.).   Off course all the information that is going to be presented from the questionnaire should use tables, diagrams, graphs, pictures, summaries and reports, which help better understand the information resulted from the research questionnaire. (Fink & Kosecoff, 1985)

References:

  • Stoop, I., Billiet, J., Koch, A. & Fitgerald, R. (2010) Improving Survey Response; Lessons learned from the European Social Survey. JohnWiley & Sons, Ltd. 1st Edition. West Sussex, United Kingdom
  • Rothged, J., Willis, G. & Forsyth, B. (2001) Questionnaire Pretesting Methods: Do Different Techniques and Different Organizations Produce Similar Results?. Proceeding of the Annual Meeting of American Statistical Association. Available at: http://www.amstat.org/sections/srms/Proceedings/y2001/Proceed/00476.pdf
  • Thomas, S. (1999) Designing Surveys That Work; A step-by-step guide. Corwin Press, INC. Thousand Oaks, California.
  • Fowler, F. Jr. (1993) Survey Research Methods. SAGE Publication, INC. Second Edition, Vol. 1.  Newbury Park, California.
  • Fink, A. & Kosecoff, J. (1985) How to conduct surveys; A step-by-step guide. SAGPublications, INC. Beverly Hills, California

RESEARCH BRIEF: What is survey research?

By Edgar Arias, earias@vt.edu

Survey research is an observational study mode in the social sciences that gathers information from respondents through the application of a questionnaire, with the purpose of making inferences about the population respondents belong to (Babbie, 2010).  This method is usually preferred when the unit of analysis is the individual person; however, it is also widely used for studies that involve groups or organizations, such as markets or companies.  Surveys are observational rather than experimental because their intent is to capture information without influencing the unit of analysis.  Survey research is an effective way to collect data because the observation can be carried out indirectly – the researcher does not need to be physically with the respondents, instead, it may be self-administered.  Additionally, only a sample of the total population can be observed to make inferences about the whole, as long as the sample is randomly selected.  It is considered as a quantitative method: its purpose is to make inferences about the population the respondents belong to.  Here, the respondent is the individual person that provides data by answering the survey questionnaire.

picture survey research
Figure 1 – Relationship between Purpose of Research and Appropriate Statistics

Goals of Research Survey

Survey researchers may have one or multiple goals to conduct a study.  According to the nature of these goals, studies can be classified as exploratory, descriptive, explanatory or a combination of these.  Exploratory studies are conducted when the researcher is interested in increasing his understanding of the relevance of a topic to a given population, or to assess the feasibility of conducting a larger study.  Descriptive surveys are designed to describe the characteristics and behaviors of the population.  Explanatory surveys area carried out when there is an interest in understanding why things happen (Vaske, 2008).

In order to achieve this objectives, survey researchers generally need to complete following phases:

  1. Specifying the research questions and hypothesis
  2. Design the survey and the implementation plan (i.e. survey methodology)
  3. Collect and analyze data

Continue reading “RESEARCH BRIEF: What is survey research?”

RESEARCH BRIEF: Geographic Information Systems (GIS) on Marketing Mix

by Melissa Brenes-Bastos, mbrenes@vt.edu

By combining conventional marketing techniques with geospatial methods enables users to picture the spatial distribution of data in maps -such as the distribution process, the market diverse- also complementing it with statistical graphs and diagrams will link marketing and GIS. (Musyoka, Mutyauvy, Kiema, Karanja,  & Diriba, 2007).

The main focus of this research is on GIS application for the marketing mix (4 P’s), which refers to the main element on a marketing strategic plan. Hess, Rubin & West (2004) research and present some ways in which GIS can support the activities of the four elements of the marketing mix.

Continue reading “RESEARCH BRIEF: Geographic Information Systems (GIS) on Marketing Mix”

Center for Forest Products Marketing delivers workshop in International Marketing with Purdue


Blacksburg, VA. May 31, 2013
. Dr Henry Quesada from the Department of Sustainable Biomaterials at Virginia Tech and Dr. Eva Haviarova from the Department of Forestry and Natural Resources at Purdue University jointly organized a workshop in International Marketing for Forest Products Industry. The workshop was delivered in May 28, 2013 at the Vincennes University campus in Jasper, IN with a total attendance of 18 participants from the furniture industry and state and government agencies.

DSCF2335
Mike Seidl from IDNR addresses participants during the workshop.

Jasper is located in southern Indiana, a place where manufacturing is the key economic development driver for the region. There are many furniture industries that have manufacturing operations in Jasper, most of them kitchen cabinet and office furniture. Although this particular industry places most its production in the local market, there is a growing interest in exploring possibilities in international markets.

As a way to educate and provide leads on international opportunities, this workshop brought together an outstanding pool of experts from industry, goverment, and the academic sectors. Mr. Mike Cooper, from the US Commercial Service, provided participants with directions on how to conduct a succesfull international marketing plan. Mr. Mike Seidl, from the IDNR, gave insights and leads on main international markets for kitchen cabinets and office furniture, and Mr. Steve Klinger, from Cargo services, provided critical information on logistics issues. Dr. Henry Quesada also presented and focused on main principles governing international marketing. The workshop was introduced by Dr. Eva Haviarova who reviewed the connection between the housing market and the furniture industry.

Thirty four percent of the participants evaluated the workshop as excellent and 66% as good. If you wish to have more information on current research on international marketing for forest products industry, please contact Dr. Henry Quesada at quesada@vt.edu