Efficiency and Performance measurement: Application of DEA in Forest products Industry

by Gaurav Kakkar, kakkarg@vt.edu

Forest products industry is extremely complex by nature. With an aim to develop sustainably, this mature industry have to deal with demanding and wide variety of performance measures. Thus determination of efficiency in such situations is highly difficult. But with the ever growing completion, the companies to need to be efficient in order to compete and survive even with low net profit margins (Sporcic & Landekic, 2014). In such cases where the business work in such complex environment, independent efficiency measures might become isolated approach for business assessment. Rather comparison of performance between firms operating on a similar transformation process might be more useful. This is measure of relative performance (Salehirad & Sowlati, 2006). Relative efficiency is measured by the ratio of relative efficiency of weighted sum of outputs and weighted sum of inputs. The basic requirement for this computation is a set of predefined weights across all units. This becomes a difficulty while obtaining common set of weights. Even after selection of weights the units of parameters become an issue.

Data Envelopment Analysis (DEA) is one of the optimum tool handling such measurement problem. Developed by Charnes et al. (1978), the approach measures relative efficiencies of individual decision making units (DMU) by optimizing weighted output/input ratio. The transformation process is driven by the actions of DMU. While measuring efficiency, it can be multiple peer entities with same transformation process (for eg. Saw mills using similar techniques in the U.S.) or a single entity with different resource utilization over time. DEA is a non-parametric approach, i.e. the inputs, outputs related to the transformation process need not to have the same units of measurement (Triantis, 2012). In other words, for example labor hours, capital investment, overtime, number of machines, board feet of finished lumber, electricity consumption, CO2 emissions, waste generated etc. can be used in their original units while measuring the efficiency of the operation. This removes the need to convert all the inputs and associated outputs measures to a uniform unit. Another feature of DEA technique is weights optimization. Unlike other efficiency measurement techniques like regression analysis, there is no need to assign predefined weights to the parameters of the process. The approach sets up a frontier of efficient DMUs using relative efficiency measures (Triantis, 2012). There are different mathematical models to conduct DEA analysis but CCR (Charnes, Cooper and Rhodes) model (Charnes, Cooper, & Rhodes, 1978) and BCC (Banker, Charnes and Cooper) (Banker , Charnes, & Coooper, 1984) are most frequently used. According to Farrell (1957), technical efficiency represents the ability of a DMU to produce maximum output given a set of inputs and technology (output oriented) or, alternatively, to achieve maximum feasible reductions in input quantities while maintaining its current levels of outputs (input oriented).

DEA is specifically applicable in cases where there are no clear success parameters, and when same efficiency can be achieved using different resources combinations. Thus in such cases, measuring the degree of efficiency individual entities in relation to others acting in the similar conditions with same transformation process might be of more interest. It have been widely applied in different areas for measuring productivity and efficiency. It has also been used for making comparisons between organizations, companies, regions and countries. Application also extends in banking, agriculture, wood industry, management of renewable resources, schooling, etc. for evaluating business performance (Sporcic & Landekic, 2014). The organizations can thus learn from the best performing peers and adapt to move towards the efficiency frontier. The outputs of the analysis, depending upon the method used, also gives the excess of inputs or deficiency in outputs in comparison. That is the measure of technical efficiency. The similar analysis when coupled with the unit cost information can be used to draw allocative efficiency. These efficiency measurements and comparison with the frontiers can be used to develop strategy and benchmark performance goals and objectives.

The following section highlights few examples as possible application of this technique in efficiency measurement of different features of forest products industry.

  • Sporcic & Landekic (2014) applied this technique to measure productivity and efficiency of 48 forest management offices in Republic of Croatia. All the offices were managed by Croatian Forests Ltd. and were responsible to manage 80% of the national forest cover. The authors used most commonly used DEA models, CCR and BCC to evaluate relative efficiency. Table 1 lists the inputs and outputs used by the authors.

Table 1 List of Inputs & Outputs used by Sporcic & Landekic (2014)

Inputs Outputs
Land, (forest area in thousand hectares) Revenues, (yearly income in hundred-thousand croatian kunas)
Growing stock, (volume of forest stock in cubic meters per hectare) Timber production, (timber harvested in cubic meters per hectare)
Expenditures, (money spent in hundred-thousand croatian kunas) Investments in infrastructure, (forest roads built in kilometers)
Labor, (number of employees in persons) Biological renewal of forests, (area of conducted silvicultural and protection works in hectares)

The results included the global technical efficiency (using CCR model), local pure technical efficiency (using BCC model) and determine scale of the transformation process. The authors also calculated efficiency frontiers, number of efficient units, identify sources and values of inefficiencies and impact of structural characteristics of forest offices (number of employees, growing stocks and surface area) on their overall efficiency. The results showed that 31% of the DMUs were found efficient according to CCR model and 50% using BCC model.

  • Upadhyay, Shahi, Leitch, & Pulkki (2012) used DEA in analyzing 24 lumber mills in northwestern Ontario, Canada to measure relative technical efficiency from data over the period of 10 years (1999-2003 and 2004-2008) using the average values for each period. Table 3 lists set the 4 inputs and 1 output used in the study. The authors conducted two set of analysis with and without using energy as an input.

Table 2 List of Inputs & Outputs used by Upadhyay, Shahi, Leitch, & Pulkki (2012)

Input
Materials (Log volume) Labor (man-hours)
Energy

Hog-fuel

Electricity

Output
Lumber Volume

The results of DEA show that while some mills (DMUs) improved their performance over the two period with limited resources, others saw a decline in their performance. With considering energy as an input, more mills reported a negative change in the efficiency. One of the probable explaination by the authors for decrease in the efficiency is reduced production in the second period. Those mills failed to adjust their inputs (mainly labor) and were running with more than required resources.

  • Runsheng (1998) demonstrated the application of DEA to conduct production efficiency analysis on 65 mills producing unbleached linearboard sector in North America in 1994. Authors used 8 inputs and 1 output (Table 3) to measure the economies of scale, technical efficiency and allocative efficiency. The results showed that most of the analyzed DMUs were technically efficient but only few maintained allocative efficiency. The analysis also showed that most of the mills demonstrated constant returns to scale.

Table 3 List of Inputs & Outputs used by Runsheng (1998)

Inputs
Fiber (BDST/FST) Labor

Operating labor (MH/FST)

Salaried (MH/FST)

Chemicals (lb/FST) Materials (unit/FST)
Fuel (MCF/FST) Delivery (mile/FST)
Power (kWh/FST)
Outputs
Finished short ton production (Annual)
BDST= Bone-dry short ton, FST= Finished short ton, MCF=1000 Cubic feet, MH= manhour

Thorough just these three examples, it’s clear that Data Envelopment Analysis (DEA) is a powerful tool for relative efficiency and performance measurement. Though its application in forest products industry is fairly limited as of now as compared to other industries (Sporcic & Landekic, 2014) but it certainly has the potential to be useful tool for resource management and strategy design for the U.S. Forest Products Industry.

References

  • Banker , R., Charnes, A., & Coooper, W. (1984). Some Models for Estimating Technical and Scale Inefficiencies in Data Envelopment Analysis. Management Science, 1078-1092.
  • Charnes, A., Cooper, W., & Rhodes, E. (1978). Measuring the Efficiency of Decision Making Units. European Journal of Operational Research, 429-444.
  • Farrell, M. (1957). The measurement of productivity efficiency. Jouranl of the Royal Statistical Society, 253-281.
  • Runsheng, Y. (1998). DEA: A new methodology for evaluating the performance of forest products producers. Forest Products Journal, 29-34.
  • Salehirad, N., & Sowlati, T. (2006). Productivity and efficiency assessment of the wood industry: a review with a focus on Canada. Forest Products Journal .
  • Sporcic, M., & Landekic, M. (2014). Nonparametric Model for Business Performance Evaluation in Forestry. In J. Awrejcewicz (Ed.), Computational and Numerical Simulations. InTech. doi:10.5772/57042
  • Triantis, K. (2012). Engineering Applications of DEA. In Handbook of Data Envelopment Analysis. Kluwer Publishers.
  • Upadhyay, T. P., Shahi, C., Leitch, M., & Pulkki, R. (2012). An application of data envelopment analysis to investigate the efficiency of lumber industry in northwestern Ontario, Canada. Journal of Forestry Research, 657-684.



Value Stream Mapping: Visualization of Operations

Gaurav Kakkar, email at kakkarg@vt.edu

A value stream of a product is all the actions associated with conversion of supplier filled raw materials to consumable finished product. It includes all the internal activities that must be performed within each tier of supply chain to make the final product (Rich, et al. 2006). Value Stream Mapping (VSM) is a portfolio of techniques to analyze this flow of material and information in a production system from door to door operations. The exercise includes mapping all the processes involving flow of information or materials in the company. It is suitable tool to facilitate decision makers, operators to visualize and analyze the operations to recognize waste and identify its causes. Thus it can be used to view and diagnose current status and develop strategies for future improvements making it an effective method for illustrating and redesigning the value streams. The method originates from the Toyota Production System (Ono 1988) and consists of two main phases: value stream analysis and value stream design. The first phase aims at visualizing the current value stream and the second aims at identifying the wastes.

There are three types of operations being undertaken at a facility (Monden 1993):

1. Non-value adding (NVA)
2. Necessary but non-vale adding (NNVA) and
3. Value Adding (VA)

NVA activities like waiting times, double handling etc. are pure wastes and involves unnecessary actions. NNVA, on the other hand are wasteful but are necessary to support the value adding operations and making of the product. It is impossible to eliminate them completely. The value adding operations, VA involves conversion of processing of raw materials or semi-finished products. VSM helps in categorizing the production operations into these categories and obtain a complete systemic view. Toyota Production System (Ono 1988) identified following 7 wastes which prevents a system a go leaner:

1. Overproduction
2. Waiting
3. Transport
4. Inappropriate processing
5. Unnecessary Inventory
6. Unnecessary motion
7. Defects

Hines and Rich (1997) and compiled seven tools of value stream mapping that can be used to target each of the above mentioned seven manufacturing wastes. Each of these tools have varying application in identifying the wastes and thus can be used in combination with each other. Below is the brief introduction of these tools.

1. Process Activity mapping: In this mapping methodology, a vital piece of raw material is followed in the entire production process. Those steps in conversion process that add value for which the consumer would be willing to pay are called Operations and rest non value adding are classified as waste. The map can be used to identify value adding fraction of total time that the material spends in the production system.

2. Supply Chain Responsiveness matrix: This mapping technique uses cumulative inventory in days at every stage of the production process and plots it against the time to plan and move from one stage to another. The resultant graph can be used to identify problems in material flow.

3. Product Variety funnel: This methodology is applicable to production systems involving standard raw materials and a variety of final product types. By tracking the production process, the management can identify the point up to which the manufacturing stays generic without differentiation. Maintaining a generic stock buffer till the point allows that allows rapid expansion and finish products to fulfill consumer orders.

4. Quality Filter mapping: This mapping technique highlights waste generated in each stage of production. This waste can be scrapped product, rework or service defects. Such a mapping can facilitate managers to focus on stages to make quality improvements and eliminate waste.

5. Forrester Effect mapping: This mapping highlights delays with scheduling and actual production with respect to demand fulfillment. It compares demand forecast, actual shipments, launch of production batches and ordering of raw materials in a line graph. A perfectly lean system would have a series of flat lines.

6. Decision Point Analysis: This is a great tool to identify ‘make to order’ points in a production system. It uses the total production times through the factory and the waiting time the customer would accept. It is mostly applicable where the aim is to reduce lead time for customers.

7. Overall Structure maps: This tool is different from the other mapping tools as it shows the number of suppliers for each stage of production, companies engaged in distribution channels of the firm and the value each one of them adds to the final product.

While none of these tools provides a sufficient and robust solution to all of the management problems, an optimal combination of them can be used to address the key issues. Table 1 shows the application and level of usefulness of these tools to eliminate each of the seven wastes and characterize the system.

Table 1. Value stream mapping tools and their application

Mapping tools
Waste/structure Process activity mapping Supply chain response matrix Production variety funnel Quality filter mapping Demand amplification mapping Decision point analysis Physical structure

Volume and value

Overproduction L M L M M
Waiting H H L M M
Transport H L
Inappropriate processing H M L
Unnecessary inventory M H M L H M L
Unnecessary motion H L
Defects L H
Overall Structure L L M L H M H
Notes: H= High correlation and usefulness

M= Medium correlation and usefulness

L= Low correlation and usefulness

Source: (Hines and Rich 1997)

The process targets lean, agile and pull controlled value chains with shorter lead times and reduced inventories (Rother 2003, Nash and Poling 2011). The research team at SIM is extending this knowledge to the secondary forest products industry in support their attempts to go lean.

References

  • Hines, Peter, and Nick Rich. 1997. “The seven value stream mapping tools.” International Journals of Operations and Production 46-64.
  • Monden, Y. 1993. Toyota Production System: An Inegrated Approach to Just-in-Time. 2nd. Cambridge, MA: Productivity Press.
  • Nash, Mark A, and Sheila R Poling. 2011. Mapping the Total Value Stream. CRC Press.
    Ono, T. Toyota. 1988. Production System: Beyond large-Scale Production . Productivity Press.
  • Rich, Nick, Nicola Bateman, Ann Esain, Lynn Massey, and Donna Samuel. 2006. Lean Evolution: Lessons from the Workplace. New York: Campridge University Press.
  • Rother, M. 2003. Learning to See: Value Stream Mapping to Add Value and Eliminate Muda. Lean Enterprise Institute.

RESEARCH BRIEF: Internationalization of U.S. forest products industries: Opportunities and barriers.

by Gaurav Kakkar, kakkarg@vt.edu

Development of global economy have led to significant increase in the level of globalization. The companies now look at geographical expansion as an opportunity to grow. This also implies that these companies need to prepare themselves for the challenges not seen in the native markets (Lu & Beamish, 2001). The industries thus need to learn and adapt to new culture, environment and markets. The global forest product industry, traditionally evolved to be heavily dependent on locally harvested resources. This gave an advantage to forest-rich regions over the others for potential production and processing installations. The majority of the industries would preferably be located close to the forest due to high transportation and handling costs. Recent advancement in harvest and handling technologies, forest management, expansion of planted forests etcetera have led to a major change in this traditional view. The processing industries no longer have to tie themselves with the close proximity of forest (Bael & Sedjo, 2006). As a result, the forest products industry can now share and impact the globalization. The products and services can now be directed to specific regions of the world where they can be most effective. More and more people across the world can now be benefited from the new and innovative methods. Despite this substantial change, the very nature of wood resource still limits the feasible expansion of this industry.

United States leads global production and consumption of forest products. But this share have been declining since 1990 (Farmer, 2015). This article thus aims to highlight few of the major opportunities and barriers for internationalization of specific product categories in the forest products industries.

Opportunities (Prestemon, Wear, & Foster, 2015):

  1. The forest management program in the United States assures that the derived products are environmental friendly. This gives industry an added advantage in the markets with growing concern of nature friendly products.
  2. Asian market has high potential for furniture industry. The U.S. companies can expand and be competitive in this market segment.
  3. With positive recovery after the housing decline, the companies can increase investment in this sector. Foreign housing markets can also be explored for expansion.
  4. Wood pellets manufactured in the U.S. can target the renewable energy market across the world, especially Europe.
  5. An increase in demand in biomaterials sector for wood fiber is also expected. It includes construction, auto manufacturing and personal care products.
  6. The timber supply from the U.S. have increased considerably over time and this further will support the comparative advantage in global markets.
  7. New initiatives to use wood as structural component in tall buildings can open up new market segment for U.S. forest products industry.

Barriers:

Any industry attempting to do business in a foreign market tends to face certain trade barriers. These can be broadly classified into tariff and non-tariff barriers.

  1. Tariff trade barriers: A tariff (duty) is the tax on the value of product including freight and insurance of imported product levied by the government. The rates depend upon nature of product and vary between countries. Additional taxes (national and local), customs fee are often collected along the tariff at the time of customs clearance. This leads to increase in the cost of delivered good. Most of the U.S. made/originating products can qualify for duty free entry in more than 20 countries that have signed Free Trade Agreements (FTA).
  2. Non-tariff trade barriers (Sun, Bogdanski, Stennes, & Kooten, 2010):
    1. Import quotas, export quotas and tariff quotas are some of the most common quantitative restrictions on the volume of different wood products.
    2. Complexity of licensing procedures, customs, financial transactions act as administrative restrictions and vary from one country to another.
    3. Different price control measures employed in the target market like custom surcharges, import taxes, minimum/maximum price limits, prior deposits, anti-dumping and countervailing duties.
    4. Domestic policies aiming to improve the competitiveness of domestic producers in international markets. These include producer or exporter subsidies, financial assistance to domestic industries, tax concessions etc.
    5. Forest management certification and product labeling to assure that the forest was sustainably managed and is an environmental friendly product is growing to be an important barrier.

These are the few of the key available opportunities and associated barriers that the forest products industries in the United States have to consider while successfully expanding to global markets. Development of new technologies and applications of forest products in this adapting global market can provide a major opportunities to all associated industries.

References

Bael, D., & Sedjo, R. (2006). Toward Globalization of the Forest Products Industry: Some Trends. Resources for the future discussion paper.

Farmer, S. (2015, December 3). U.S. Forest Products in Global Economy. Retrieved from Compass live: Southern Research Station: http://www.srs.fs.usda.gov/compass/2015/12/03/u-s-forest-products-in-the-global-economy/

Lu, J. W., & Beamish, P. W. (2001). The Internationalization and Performance of SMEs. Strategic Management Journal, 565-586.

Prestemon, J. P., Wear, D. N., & Foster, M. O. (2015). The Global Position of the U.S. Forest Products Industry. Asheville: Southern Research Station, USDA.

Sun, L., Bogdanski, B., Stennes, B., & Kooten, G. C. (2010). Impacts of tariff and non-tariff trade barriers on the global forest products trade: an application of the Global Forest Product Model. International Forestry Review, 49-65.


Research brief: Prefabricated Construction and its Adoption in the United States of America

by Gaurav Kakkar, Virginia Tech MS student. kakkarg@vt.edu

Introduction

Traditional construction process involves shipping of raw materials to the construction site. The contractor/sub-contractors would then use on-site workers to process and use them in building. Since most of the work is done on site, majority (up to 90%) of the total cost is incurred on the actual construction site (Somerville, 1999). This means majority of the project is done in open, uncontrolled environment. Instead, Prefabricated construction refers to construction for which 2/3 or more construction process are finished in factory and the main parts of the house, such as walls and floors, are fabricated following certain industry standards. This gives builders an option to build faster assuring safety and quality at lower prices as compared to on-site construction (WoodWorks, 2014). The components are prefabricated in batches and then shipped to site for assembly. The level and nature of prefabrication can vary from project to project.

pic1
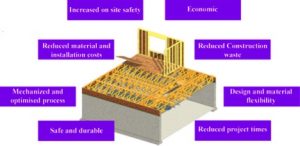
Benefits of pre-fabricated panelized wood construction

Depending upon the extent of prefabrication, these off-site manufactured systems can vary from just pre-cut and prefabricated components to panelized leading up to fully advanced modular systems. These are also called building systems (Na, 2015). Factory manufactured components in these systems replace some of the on-site labor built structures. The process is mainly feasible in repetitive components of house like, walls, floors, doors and windows etc. which when assembled easily on site can be very effective in saving time.

Evolution of Building Systems in Wood construction

Home manufacturers provide builders with a different product types with varied degree of prefabrication. These houses in the United States are manufactured strictly according to the concerned state wide building codes. This report does not include the manufactured/mobile housing which is regulated under HUD codes.

Prefabricated systems

This is the most basic type of off-site factory manufacturing of building components. This system evolved with the wide spread of lumber mills which started to supply processed dimensional lumber to the builders. All the cutting, drying and processing is done in a central location and then supplied to the builder on the construction site. The builder would then use these to make walls, floors or roof systems. This system further gained popularity with the development of engineered wood products like Structural Insulated Panels (SIP), trusses, I-joists (WoodWorks, 2014) etc. which required mechanized manufacturing by skilled labor and cannot be done easily on the construction site. The manufacturers now make them in many configurations and types giving builders a wide variety to select from to fulfill the design and regulatory requirements.

Panelized systems

pic3
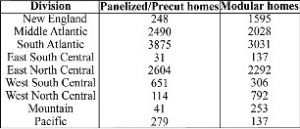
Number of factory build homes in different regions of the USA (3.4% of total single family units in 2014)

With further development in factory manufacturing of wood products, the wood products industry moved to assembling the prefabricated products into larger panels or complete assemblies. These panelized systems can be engineered according to construction design. Use of computer added design further helps the manufacturers to manufacture exact dimensions quite easily (WoodWorks, 2014). Using panelized systems, complete wall panels, floor and roof systems can be delivered to the site ready for assembly and installation. Some systems come even with plumbing and electric fittings so that factory built systems are not tampered.

Modular systems

This is the most advanced building system in which the entire house is divided into independent modules during the design. These modules are then built in a factory on a production line like any other manufacturing. Controlled environment, skilled labor and use of automation in construction makes this off-site manufacturing very quick as compared to on-site construction. These modules are fitted with all the utility fittings and insulated properly before they leave the facility. Some modules might even come with interior finishing like carpeting, kitchen cabinets and shelves etc. A complete module is transported to the job site where it would be connected and sealed with the rest of the structure to complete the building. This type of the building system has maximum amount of prefabrication ranging up to 95% of the total construction work done off-site. In order to assure sufficient safety and durability, the modules are inspected at factory during construction and on site at the time of installation as well. This method can complete a project in half the time as compared to traditional stick built on-site construction (WoodWorks, 2014).

Adoption of prefab system in the United States.

Prefabrication in residential construction is not a new concept. The first adoption of off-site construction in the United States dates back to mid-1800s (O’Brien, Wakefield, & Beliveau, 2000) but the industry is still to have a widespread acceptance of advanced prefabricated systems. This is supported by 2014 Survey of Construction (Zhao, 2015) which reported that only 10,334 single family panelized/precut home and 10,560 single family modular homes were started in 2014 which also were geographically concentrated in East North central, South and Mid-Atlantic regions of the country. This amounts to 3.2% of the total single family residential construction in 2014. Along with less adoption, the market penetration of off-site construction was observed to be diverse.

Drivers for future growth

The key feature of off-site construction and adoption of factory manufacturing techniques in construction sector is improvement in project schedules. With optimized manufacturing processes, builders can achieve a considerable improvement in time taken to complete a project. Including prefabrication can also reduce construction costs mainly by optimizing material use and reducing waste. There can be substantial improvement in site safety with majority of the work done in the controlled environment of a manufacturing facility. Green and Energy efficient buildings can be constructed in a more efficiently by including prefabrication. Prefabrication in construction can also give builders and architectures a flexibility to use wide range of materials and work without any interruption by inclement weather conditions (McGraw-Hill Construction, 2011). As the industry gain more maturity, these factors In future would further encourage the builders to adopt higher levels of off-site manufacturing in residential construction.

References

McGraw-Hill Construction. (2011). Prefabrication and Modularization: Increasing Prductivity in the Construction Industry. Bedford, MA: McGraw-Hill Construction.

Na, Z. (2015, October 1). System Built Single Family Homes in 2014. Retrieved February 10, 2016, from Housingeconomics: http://www.nahbclassic.org/generic.aspx?sectionID=734&genericContentID=247892&channelID=311

O’Brien, M., Wakefield, R., & Beliveau, Y. (2000, July). Industrializing the residential construction site. Retrieved from HUD User: http://www.huduser.org/portal/publications/manufhsg

Somerville, C. T. (1999). Residential Construction Costs and the Supply of New Housing: Endogeneity and Bias in Construction Cost Index. The Journal of Real Estate Finance and Economics, 18(1), 23-62.

WoodWorks. (2014). Putting the Pieces Together. WoodWorks.

Zhao, N. (2015). System-built single family homes in 2014: Special Study for housing economics. Retrieved from http://www.nahbclassic.org/generic.aspx?sectionID=734&genericContentID=247892&channelID=311


Research Brief: advantages and disadvantages of bio-butanol

by Li Liang, lli91@vt.edu

Renewable energy sources is an attractive option for ensuring future energy security (Sharma et al 2013), since it can reduce the fossil fuel dependency and mitigate climate change (Cherubini et al 2011). Therefore, researchers devote a lot to study and develop new energy, such as ethanol and biodiesel. However, a very potential overlooked energy substitute is bio-butanol (Kenneth 2010). Bio-butanol is an alcohol that can be used as the direct replacement for gasoline, due to its low water miscibility, similar energy content and octane number with gasoline, blending ability with gasoline in any proportion, and its directly utilization in gasoline engine(Kumar et al 2009, Gu et al 2012). Just like second generational bio-ethanol, bio-butanol is also a renewable fuel that can be produced from lignocellulose biomass through acetone butanol ethanol (ABE) fermentation (García et al 2011).

flat butanol

Besides that, compare to ethanol, butanol has the following advantages (Dürre 2007):

  • Bio-butanol can be directly used in pure form or blended in any concentration with gasoline, while bio-ethanol can only be blended up to 85% or used as pure form in specially designed engines.
  • Regardless of using bio-butanol as pure vehicle fuel or gasoline extender, there is no need to make any modification of existing car.
  • It is safer to handle, because it has a lower vapor pressure than bio-ethanol.
  • It can be blended with gasoline at the refinery before storage and distribution, because it is not hygroscopic, while bio-ethanol could only blend with gasoline just before use.
  • Since bio-butanol is immiscible with water, it is less likely to contaminate the groundwater if it spills; while bio-ethanol is completely miscible with water and will cause water-pollution when it spills.
  • Unlike bio-ethanol, bio-butanol is less corrosive, so it can be used in infrastructure, such as pipelines, tanks, filling station, pumps, and etc.
  • It has a higher mileage/gasoline blend ratio, based on its higher energy content
  • Compare to bio-ethanol, bio-butanol has a more similarity quantity of the caloric value, octane number and air-fuel ratio with real gasoline, which means bio-butanol is more similar with gasoline in characteristics.

However, there still existing some issues in the productions and utilizations of bio-butanol (Jin et al 2011):

  • The production of bio-butanol is quite low. The production rate of bio-butanol yield from ABE fermentation is 10-30 times lower than the bio-ethanol produce from yeast ethanol fermentation process.
  • Although bio-butanol has a higher energy density than other low-carbon alcoholic biofuel, its heating value is still lower than the real gasoline or diesel fuel, so it needs to increase the fuel flow when it uses as a fossil fuel substitute.
  • Bio-butanol is a kind of alcohol-based fuels, so it still cannot compatible with some fuel system components, and may cause gas gauge reading mistakes in vehicles with capacitance fuel level gauging
  • Bio-butanol may yield more greenhouse gas emissions per unit motive energy extracted compare to bio-ethanol, due to it contains fewer octane number. Higher octane number means greater compression ratio and efficiency, and higher engine efficiency can achieve less greenhouse gas emissions.
  • The higher viscosity of bio-butanol may lead to a potential corrosive or aggradation problem when it was used in Spark-ignition engines.

From the above illustration, we can see that although bio-butanol still need some further developments, since it still has some issue. However, compare to the other lignocellulose bio-fuel it has much more advantages, such as compatibility with infrastructure and relatively less pollution. Therefore, with further improvements or upgrade, the bio-butanol are believed to be the next generation biofuel, since it can reduce the carbon footprint, mitigate the supply and price fluctuation during the transportation sectors, relieve the energy security problem, and provide related job opportunities to improve social equality (Yue et al 2014).

References:

  • Szulczyk, K.R. (2010). Which is a better transportation fuel – butanol or ethanol? International journal of energy and environment, 1 (2010) 501-512
  • Sharma, B; Ingalls, R.G; Jones, C.L; Khanchi, A. (2013). Biomass supply chain design and analysis: Basis, overview, modeling, challenges, and future. Renewable and Sustainable Energy Reviews, 24 (2013) 608-627
  • Cherubini, F; Strømman, A.H. (2011). Life cycle assessment of bioenergy systems: state of the art and future challenges. Bioresource Technology, 102 (2011) 437–451
  • Kumar, P; Barrett, D.M; Delwiche, M.J; Stroeve, P. (2009). Methods for Pretreatment of Lignocellulosic Biomass for Efficient Hydrolysis and Biofuel Production. Industrial and engineering chemistry research, 48 (2009) 3713-3729
  • Gu, X; Huang, Z; Cai, J; Gong, J; Wu, X; Lee, C. (2012). Emission characteristics of a spark-ignition engine fuelled with gasoline-n-butanol blends in combination with EGR. Fuel, 93 (2012) 611–617
  • García, V; Päkkilä, J; Ojamo, H; Muurinen, E; Keiski, R.L. (2011). Challenges in biobutanol production: How to improve the efficiency? Renewable and sustainable energy reviews, 15 (2011) 964–980
  • Dürre, P. (2007). Biobutanol: an attractive biofuel. Biotechnology journal, 2 (2007) 1525-1534
  • Jin, C; Yao, M; Liu, H; Lee, C.F; Ji, J. (2011). Progress in the production and application of n-butanol as a biofuel. Renewable and sustainable energy reviews, 15 (2011) 4080-4106
  • Yue, D; Slivinsky, M; Sumpter, J; You, F. (2014). Sustainable design and operation of cellulosic bioelectricity supply chain networks with life cycle economic, environmental, and social optimization. Industrial and Engineering Chemistry Research, 53 (2014) 4008–4029