WEI Lab Supports the VT FSAE team

2014 Car Rendering

Blacksburg, VA. It took over 25 hours of CAD, CAM, and CNC work to manufacture five different molds that the VF FSAE team will be using to make the panels for its prototype racing car.

2014 Car Rendering

The VT FSAE has been competing for over 26 years and they finished 13th in last year competition. For 2014, the team’s goal is to quality for the International Formula SAE competition in Michigan where 120 other Universities and colleges will compete.

2014 Car Rendering2014 Car RenderingThe VT FSAE is composed of 33 students divided in seven teams including suspension, drivetrain, engine, electrical, aerodynamics, testing, and ergonomics. The final prototype car must be built under FSAE regulations and must past a through inspection before it is allowed to compete.

VT FSAE 1
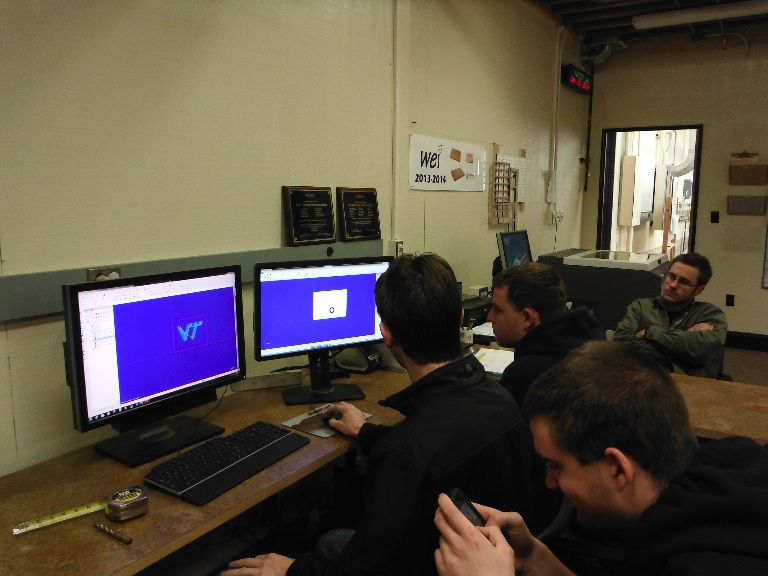
For 2014, the team is redirecting efforts to improve several of the car components, including the body. Hence, the team started a search to locate a large CNC equipment that could be used to cut the molds required for the body parts. The material used to cut the molds is a high density foam that is easy to manufacture. The WEI CNC equipment is just what the VT FSAE team needed and under the supervision of Dr. Henry Quesada the team quickly became familiar with the CAD/CAM software and the operation of the  CNC machine.

The way that the VT FSAE operates involves knowledge transfer from senior to freshman students, as key critical factor to be able to compete and complete the project which is very similar to the approach of WEI program at the Department of Sustainable Biomaterials.

VT FSAE 2

The team structure is the following

  •   Team Leader: Vincent Sorrento
  •    Team Moderator: Dan Buckrop
  •     Team Facilitator: Nabeel Ahsan
  • Sub-team structure
  • Suspension
  •         Team Leader: Hannah Bever – Chassis
  •             Nabeel Ahsan, Taylor Turner – Uprights
  •             Alex Pape – Suspension design and geometry, springs, dampers, tires.
  •             Mike Lane – Suspension Structures
  •             Cody Kees – Bell cranks
  •             James Callaway – Steering

Drivetrain

  •          Team Leader: Mackenzie Hoover – Brakes
  •             Alex Coyle – Rear chunk
  •             Alex Girard – Shifting, Simulation
  •             Kyle Torrico, Thomas Barfield – Rotating components
  •             Brian McNulty – Wheel inners, wheel outers
  •             Danny Whitehurst – Half shafts, tripod bearings

Engine

  •          Team Leader: Dan Buckrop – Engine airflow, Intake
  •             Clay Brubaker – Controls, tuning
  •             Johnny Noble, Carter Moore – Oil, Fuel, Cooling
  •             Mark Anton – Engine airflow, exhaust

Electrical

  •          Team Leader: Bryce Crane – Telemetry, diagnostics
  •             Natan Diskin – Wiring
  •             Kori Price, Glenn Feinberg, Brian Kwan – Power stream, power budget module
  •             Tyler Diomedi – Packaging
  •             Daniel Ridenour – Graduate Assistant

Aerodynamics

  •          Team Leader: Stephen Young – Under tray, diffuser
  •             Sean Lynch, Chris van Oss – Wings
  •             James Bizjak – Structures

Testing

  •          Team Leader: Brian Oeters – Test Planning & Data Acquisition
  •             Akira Madono, Dylan Verster – Test Planning & Data Acquisition

Ergonomics

  •          Team Leader: Rachel White – Project management, cost analysis
  •             Eric Peterka, Jeff Petrillo – Pedal box
  •             Matt Marchese, Lucas Keese – Steering wheel, seats
  •             Sam Ellis – Cost analysis, facilities planning.

If you have any more questions about student CAD/CAM/CNC projects that the Department of Sustainable Biomaterials support, please contact Dr. Henry Quesada at quesada@vt.edu.


Pricing optimization and demand management in the U.S. Hardwood Industry

Edgar Arias, PhD Candidate at VT. Email earias@vt.edu

As previous research shows, pricing is a key factor in the performance of a firm in international markets.  Nowadays, it is a common practice for companies to determine their prices based on cost plus a profit markup and/or market prices (Dolan, 2008).  The hardwood lumber industry usually works in a similar way.  The problem with these approaches is that they are usually based on arbitrary decisions and do not account for the risk of either setting prices to high –and therefore losing demand, or too low and leaving money on the table.  The goal of the next phase of my doctoral study is to test a pricing methodology based on the principles of Revenue Management, that have proved to be successful in increasing profits in other industries, and that may also be valuable in the hardwood lumber industry.  The focus of this phase will be centered in exporting firms because they have to deal with more challenges and complexities at the time of determining prices than those which focus on the domestic market.

Revenue Management (RM) is the discipline within Scientific Management that deals with pricing questions such as: “how much to ask?”, “when to drop the price (if at all)”, “what the asking price should be?”, “which offer to accept?” among others, towards maximizing profitability.  In other words, RM is concerned with demand-management decisions (Talluri & Van Ryzin, 2005).  In fact, RM is also known as demand management, yield management, pricing and revenue optimization, etc.

Above questions are rather old concerns in business, as old as the notion of free market itself.  But what is innovative about the RM approach is the application of principles and techniques original in Operations Research to find the right price for “every product, to every customer segment and through every channel” (Phillips, 2005).  It is based on the fact that markets are not perfect, and in those imperfections lies the opportunity to improve prices beyond what the market dictates, in such a way that profits are also improved (Ross, 2008).

Considering that RM literature in the forest products literature is practically inexistent, we will start by studying a fundamental element of the pricing optimization process: the Price-response (P-R) function.  The P-R function (also known as curve) establishes how the demand of a product varies as a result of a change in price.  This function (Figure 1) is seller specific –companies supplying the same product to the same market will show distinct curves, and has the properties of being: non-negative, continuous, differentiable and downward sloping.  Common Price response functions are: linear, logit, S-shaped, among others (Phillips, 2005).

sim Jan 14 2

Determining the P-R function is necessary to address the basic price optimization problem which consist on maximizing the total contribution m.  Each customer order sold at a price p and with a cost c, has a unit margin equal to p-c (Phillips, 2005).  Therefore we define total contribution as following:

m(p)=(p-c)d(p)

In general the total contribution function (Figure 2) is concave, with an apex located at the point where the first derivate equals zero.  In other words, the point is where total contribution is maximized and the price is optimal (p*).

sim Jan 14 1

This simple model grows in complexity as we incorporate elements such as supply constraints and price differentiation by regions.  In this study, we will analyze historic sales data in order to determine optimum pricing values for each product in each geographic region, which will serve the sales and marketing groups in negotiating with customers abroad in a lumber supply-constrained scenario.  In the process, we will map the path that follows from base prices, through invoice prices to pocket prices (Marn & Rosiello, 2008) –what companies actually charge –and determine why companies sometimes make less money per order than the market.  In other words, we will look for potential leakages in revenue and opportunities to fix them.

References

  • Dolan, R. J. (2008). How Do You Know When the Price is Right? Harvard business review on pricing (pp. 1-26). Boston: Harvard Business School Pub.
  • Marn, M. V., & Rosiello, R. L. (2008). Managing Price, Gaining Profit Harvard business review on pricing (pp. 45-74). Boston: Harvard Business School Pub.
  • Phillips, R. L. (2005). Pricing and revenue optimization. Stanford, Calif: Stanford Business Books.
  • Ross, E. B. (2008). Making Money with Proactive Pricing Harvard business review on pricing (pp. 171-200). Boston: Harvard Business School Pub.
  • Talluri, K. T., & Van Ryzin, G. (2005). The theory and practice of revenue management (Vol. 68). New York, NY: Springer.

Financial management training for sugar cane farmers in Belize

Orange Walk, Belize. December 10, 2013. During the week of December 2 2013, Dr. Henry Quesada, Assistant Professor at the Department of Sustainable, delivered a workshop in financial management to sugar cane farmers in Orange Walk, Belize. Dr. Quesada was contacted through PeaceWork, an American organization that supports and collaborates with communities in developing countries through social and training projects. PeaceWork recently established an agreement with a Belizean organization under the name of Sugar Industry Research and Development Institute (SIRDI) that supports the local sugar cane farmers through training, technology transfer, and technical assistance.

Henry Quesada teaches cost allocation to sugar cane farmers in Belize as part of the financial management training.

Orange Walk is the heart of the sugar cane industry of Belize with more than 25,000 hectares in production that are managed by over 5,000 farmers. The majority of the farmers are second and third-business generation and 90% are considered Maya people. Currently, sugar cane is delivered to a mill processing facility owned by an American company in Orange Walk. The final product, sugar, is exported to European and American markets. During the last couple of years the mill have been using bagasse, the most significant byproduct of the sugar cane milling process, to co-generated electricity and there have been conversations to provide more compensation to the farmers from the sale of electricity.

The Department of Sustainable Biomaterials at Virginia Tech is taking steps to diversify its academic portfolio from traditional renewable materials such as wood to agriculture products such as sugar cane. Sugar cane has become a significant and important crop in developing and developed countries not just because the production of sugar but also because the impact on the bioenergy and composite material markets. The training delivered to sugar cane producers in Orange Walk has designed to help farmers prepare for incoming opportunities and challenges in those markets. In total, 110 farmers where trained as well as nine of SIRDI’s staff. In addition to the delivery of the training, a financial management book was prepared with theory and examples of how to performance financial management applied to the production of sugar cane.

For additional details or questions, please contact Dr. Henry Quesada at quesada@vt.edu

RESEARCH BRIEF: Questionnaire; Step by Step

by Melissa Brenes-Bastos, mbrenes@vt.edu

Developing questionnaires had been one difficult task for students around the world, according to Thomas (1999). Developing a survey became an easy process if some steps are followed: step 1: Planning, step 1: Developing the survey, step 3: Obtaining the respondents, step 4: Preparing for data collection, step 5: Collecting the survey data and step 6: Summarizing the survey data.

www.stencil-science.edu

Step 1, 2 and 3 refers to the success on the project by planning and considering all the elements included as part of the questionnaire, creating the tool that combines all the items necessary for the research in a way that is easy for the respondent and get the sample or the list of respondents that will participate in the research, respectively. (Thomas, 1999)

One of the most important problems in survey research is the nonresponse, which occurs when one of the samples does not respond to the survey. (Stoop, Billiet, Koch & Fitgerald, 2010). Reducing the nonresponse rate is not an easy task, but improving on pretesting and evaluation of questionnaires might help on that mission, that specifically refers to Step 4 of the developing of a questionnaire. Preparations for data collection include pilot testing, which can be develop by many different methods, but basically it includes the process of giving your survey to persons who represent the respondent and then ask them to provide you information about the questionnaire (Where any items unclear? Were the directions clear?, etc.) (Thomas, 1999)

Step 5; collecting the Survey Data, can be better explain by Fowler Jr. (1993), which mentions that a reasonable sequence of events that such happen after sending the first questionnaire are: “(1) About 10 days after the initial mailing, mail all respondents a reminder card, emphasizing the importance of the study and of a high rate of response, (2) About 10 days after the postcard is mailed, mail the remaining nonrespodents a letter again emphasizing the importance of a high rate return and including another questionnaire for those who threw the fist one away and (3) if the response rate is still mot satisfactory, probably the best next step is to call nonrespondents on the telephone”.

And finally Fink & Kosecoff (1985) mention that Step 6; summarizing the survey data, cover basic things such as: 1-Type of survey (interview, self-administered questionnaires, etc.) 2-Date of survey, 3-Sample size and response rate, and 4-Other explanation (sample size, response rate, reliability, etc.).   Off course all the information that is going to be presented from the questionnaire should use tables, diagrams, graphs, pictures, summaries and reports, which help better understand the information resulted from the research questionnaire. (Fink & Kosecoff, 1985)

References:

  • Stoop, I., Billiet, J., Koch, A. & Fitgerald, R. (2010) Improving Survey Response; Lessons learned from the European Social Survey. JohnWiley & Sons, Ltd. 1st Edition. West Sussex, United Kingdom
  • Rothged, J., Willis, G. & Forsyth, B. (2001) Questionnaire Pretesting Methods: Do Different Techniques and Different Organizations Produce Similar Results?. Proceeding of the Annual Meeting of American Statistical Association. Available at: http://www.amstat.org/sections/srms/Proceedings/y2001/Proceed/00476.pdf
  • Thomas, S. (1999) Designing Surveys That Work; A step-by-step guide. Corwin Press, INC. Thousand Oaks, California.
  • Fowler, F. Jr. (1993) Survey Research Methods. SAGE Publication, INC. Second Edition, Vol. 1.  Newbury Park, California.
  • Fink, A. & Kosecoff, J. (1985) How to conduct surveys; A step-by-step guide. SAGPublications, INC. Beverly Hills, California

Educational Sessions offered for the 2014 Richmond Expo

sbio vfpa vce logos

The Department of Sustainable Biomaterials (SBIO) at Virginia Tech and conjunction with the Virginia Forest Products Association (VFPA) and Virginia Cooperative Extension (VCE) is offering an educational session on May 15, 2014 as part of the 2014 Richmond Expo organized by VFPA. The educational session is divided in two tracks. The morning track will focus on drying operations and the afternoon track will focus on financial management principles for forest products industries.

The educational session will be conducted at the Four Points by Sheraton located at 4700 South Laburnum Avenue, Richmond, vA 2321. Registration details will be set up soon, so please keep yourself tuned for more details. If you have any questions please contact Angela Riegel at (540) 231-7107 or ariegel@vt.edu. A detailed description of the two tracks can be found in this web address http://sim.sbio.vt.edu/?p=1961

Morning track: Improving The Quality of Lumber Drying Operations

Session Description

drying picture
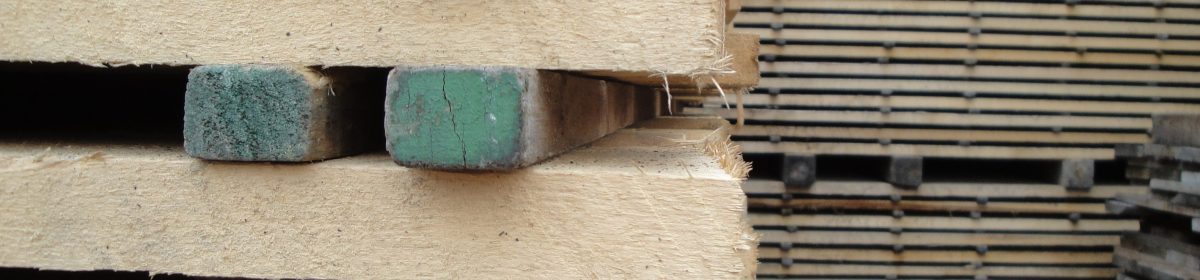
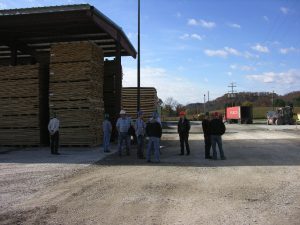
Lumber drying operations, no matter the size, must provide a good quality product to maintain their customer base. Drying defects not only lead to product value losses but if passed onto the customer can lead to lost sales. In today’s business environment, reducing warp, maintaining good color and stain free lumber, and producing stress free lumber with the proper MC is critically important.

This session is designed to assist anyone drying lumber from the small-scale lumber dryer to commercial drying operations. The techniques and information presented are relevant to both hardwood and softwood lumber drying operations.

Continue reading “Educational Sessions offered for the 2014 Richmond Expo”