RESEARCH BRIEF: Analysis of Exports from Eastern Forest Products Companies at the 2010 International Woodworking Fair

Scott Lyon, MS Candidate
Virginia Tech


 This article was published  in the October 2010 number of HMR Executive

At the 2010 International Woodworking Fair in Atlanta, Georgia, 27 exporting forest product companies were interviewed about current export markets.  The purpose of the survey was to identify export market drivers and barriers of Appalachian forest products.  In the past few years, the Appalachian region has suffered from the economic crisis including forest product mill closures and loss of employment due to an increase in global competition.  The region needs to increase product competiveness by expanding export markets and improving product promotion (Wang et al. 2010). Exporting of products offers many advantages for firms entering the global market, such as increased profits and credit, market growth, and economic strength (Parhizkar 2008; McMachon and Gottko 1989). Nonexporting companies trying to enter a global market have not primarily because lack of market information regarding product specifications and distribution channels (Ifju and Bush 1993). Overall lack of market information is the main limitation for potential exporters of forest products overseas.  A 2002 study of Appalachian hardwood lumber exports (Parsons 2002) showed that a lack of employees and production limitations did not significantly affect exporting, but the need for marketing information was a major hurdle for companies. The companies were asked to identify:

  • Top export markets
  • Drivers for exporting
  • Barriers for exporting
  • Primary products and species sold
  • Percent of production being exported

The main limitations for the study were the size of companies attending and company representation.  Primarily companies interviewed were larger, with more than 100 employees.  Also, most of the company representatives interviewed were not directly associated with the company’s export operations, so they may not have been familiar with some of the topics covered in the questions. 

Results
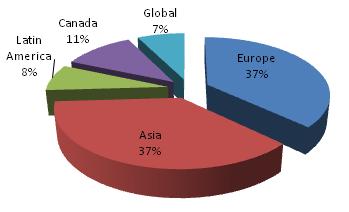
Figure 1. Export destinations

The manufacturers surveyed primarily are located in the Middle Atlantic states including Pennsylvania, Virginia and North Carolina. Most of the brokers that were interviewed had locations in the southeastern U.S. near shipping ports.  Currently, forest products companies included in the survey are primarily exporting to Europe and Asia (Figure 1), with some companies exporting to Latin America, Canada or other countries. On average 36% of the production from participants is being exported (Figure 2).
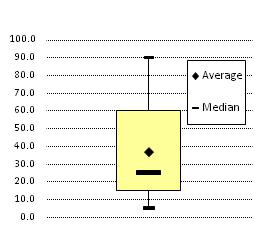
Percentage of Production Exported

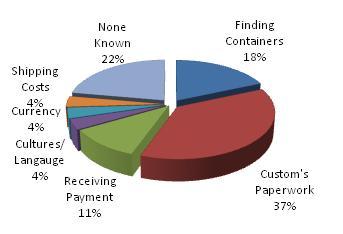
 The main products exported to Europe and Asia are Appalachian hardwood lumber and veneer, and also some furniture parts and medium density fiberboard (MDF).  Currently the main species exported to Europe and Asia is white oak (Quercus alba) (Figure 3).  It was found that veneer companies export a higher percentage (65-90%) of their production than hardwood lumber companies (15-40%).  A majority of companies interviewed exported their products through brokers.  Companies focused on exporting to Europe and Asia because of business opportunities in the furniture industry and the shrinking of the domestic secondary industry because of the economic downturn. The main barriers affecting exports are custom paperwork, such as phytosanitary documents, and new country regulations (Figure 4).   These documents may contain errors or misplaced forms, causing a delay in the arrival of the products to the customer.  Companies selling to brokers were not familiar of any trade barriers occurring.
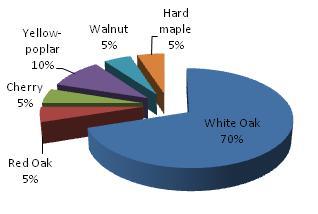
Figure 3. Appalachian hardwood lumber species exported

According to the interviewees, a shortage of shipping containers for exporting has been a problem lately.  Companies commented that returning containers back to the United States costs more than shipping them from the U.S.  This shortage of containers was brought on mainly because of a decrease in container production during the economic downturn of 2008-2009. Also Chinese container manufactures have gone on strike causing an even larger shortage during the peak shipping time from June-October (D’Altorio 2010).   Struggling economies in other countries have also deterred companies from exporting to them.  A hardwood lumber company stated a lack of continual flow of orders from Latin America has caused them to overlook that region for market opportunities.  Also, the time frame it takes to contact the product buyer in Latin America has deterred companies from doing business in that region.  One company stated it took over a year to receive an email reply from a Guatemalan company inquiring about a quote.  Receiving payments from overseas companies has also affected companies exporting to certain areas.  Most forest products companies interviewed require a letter of credit from the customer prior to taking the order.  Some companies have encountered problems with language barriers and currency exchange rates when trying to enter a new export market.  

Figure 4. Barriers effecting exporting operations

Conclusion

The amount of production exported overseas depends on the markets available for products and species.  The inconvenience of customs paperwork and the unavailability of containers is the main barrier affecting the amount of U.S. forest products exported.   Also it was found that Latin America has been overlooked for market opportunities in part because of the culture differences and past struggling economies.  The need to build relationships is critical in these countries to foster partnerships and increase trade with this region.

References

  • D’Altorio, T. 2010. The Global Shipping Container Shortage: Riding The Waves To Profits.Invest ment U Research. June 30.
  • McMahon, R.O. and J. Gottko. 1989.  Export marketing activities of small-firm lumber manufacturers. Oregon State University, College of Business and College of Forestry,Studies in Management and Accounting for the Forest Products Industry, Monograph no. 31.
  • Parhizkar, O. 2008. Identifying Impact Factors on Successful Exporting of the United States Hardwood Industries to Mexico, Asia, and Europe. Doctoral Dissertation. Virginia  Tech, Blacksburg, VA.
  • Parsons, B.A. 2002.  An Examination of Appalachian Forest Products Exports. Masters of  Science Thesis.  Virginia Tech, Blacksburg, VA

RESEARCH BRIEF: Process Boundary Analysis, a Case Study in a Furniture Manufacturer

Chao Wang, MS Candidate
Virginia Tech


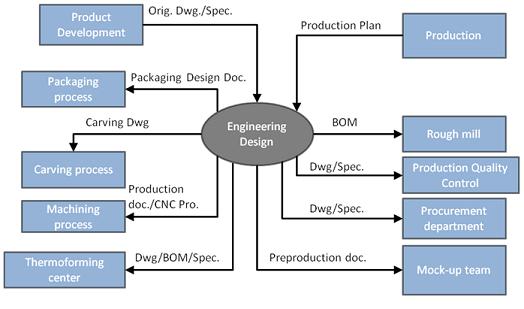
Context diagram is used to show the interaction between a system and its important external factors (Kossiakoff and Sweet 2003). We use this method to analyze the system boundary of the engineering process in a wooden furniture firm. From Figure 1, we could identify two suppliers in the current engineering design system – product development and production. In this case, product development leads the following tasks:

Ÿ   Fabricate original product samples and ship to customers for confirmation

Ÿ   Confirm the design changes and acquire product original drawings from customer

Ÿ   Compile engineering and fabrication specifications for each product collections and handover to engineering for generating production documents

Ÿ   Deliver the customer-confirmed color boards to facilitate production

Figure 1. Engineering design context diagram

The other supplier, the production department, needs to make sure that they can deliver the updated production plan to the engineering department on a timely basis because this schedule is the foundation to set up the engineering plan. As engineering always takes up a great portion of production lead time, an accurate engineering plan could always ensure the on-time delivery of products. According to our survey results in a furniture company, it shows the engineering accounts for 21%-40% of production lead time.

In the customer perspective, engineering provides service for a number of manufacturing processes:

Ÿ   Rough mill: since rough mill is responsible for processing the raw material into treated material that prepared for machining process. So engineering provide bills of material to the rough mill by providing the following information:

  • The quantity of materials needs to be prepared
  • The rough and net dimension of each pre-machining component
  • The number of each component
  • The board dimension for panel gluing or brick stacking

Ÿ   Machining process: engineering needs to provide machining process with a number of essentials:

  • Fabrication drawings for making components
  • Assembly drawings for subassembly and final assembly of products
  • Profile drawings for verifying the precision of component fabrication accuracy
  • Programs for CNC manufacturing
  • Bills of material for checking component dimension and part number
  • Bills of material (BOM) to require hardware and accessories for assembly

Ÿ   Production quality control: engineering provides essential assembly drawings, instructions, and specification to help quality control ensure the quality of products during production proces

Ÿ   Thermoforming center: in general, this process has three functions:

  • Provide wood-based panel to production plants. In this case, the engineering needs to prepare bills of material for thermoforming process that indicates the amount and dimension of the material in demand.
  • Fabricate fancy panel for production. In this case, the engineering provides them with veneer drawings for parqueting veneer on face panels.
  • Fabricate plywood panel. In this case, the engineering provides drawings for verifying the shape of fabricating panels. Also, the CNC engineers are responsible for providing programs for the die fabrication.

Ÿ   Carving process: engineering provides carving drawings to the carving process

Ÿ   Packaging process: packaging engineer takes in charge of generating packaging documents for packaging process. A packaging document typically includes the drawings, bills of material, and instruction of packing up a specific furniture product

Ÿ   Procurement department: engineering provides drawings and specification for the new material and tooling purchase

Ÿ   Mock-up team: this team taking in charge of implementing preproduction and it is a very necessary step before mass production. It has the full function in mass production. Thus engineering not only provides preproduction documents for this process, but also track the fabrication progress and help to solve problem due to design flaws.

Reference:

Kossiakoff, A., and W. N Sweet. 2003. Systems engineering: principles and practice. Wiley-Interscience.

RESEARCH BRIEF: The Future of Raw Material for the Wood Pallet Industry

By Leslie Scarlett Sanchez
Department of Wood Science and Forest Products
Virginia Tech


The use of wood pallets is expected to grow, therefore; the sourcing of wood materials for pallet manufacturing requires attention. It is believed that wood pallet manufacturers will face increasing competition for raw materials from producers of wood-based composites, paper and paperboard, and biomass-based energy. Part of our research at VT is focused on identifying suppliers of wood pallet materials, meaning if they are domestic and/or imported. And going a little far, we would like to identify new possible sources of raw material, due to the increasing competition in the acquisition of wood pallet materials. An overview of roundwood production from 1997 to 2008  and main producer countries is presented in this research brief.  

Roundwood production  

Roundwood production is divided in two types: Hardwood and Softwoods. Figure 1 shows the respective quantities for each one and their respective trends through 1997 and 2008 in the United States. It can be seen that there is a decrease over the years for hardwood production. However, softwood production is increasing since 2002 until 2005, and decreases through 2008.  

Figure 1. Roundwood Production in the United States (FAO, 2010)

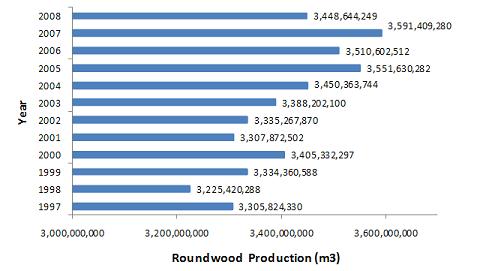
It is also important to identify the amount of roundwood in the World as shown in Figure 2. Similar to Figure 1, it shows an increase in roundwood production.  

Figure 2. Global Roundwood Production (FAO, 2010)

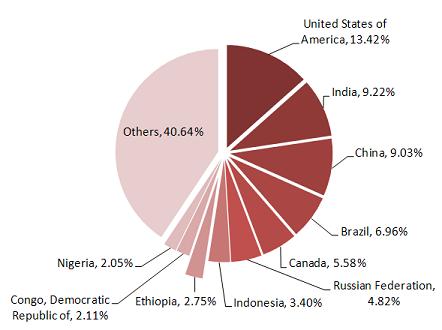
 Figure 3 shows the production of roundwood of the 10 ten most important country producers by volume and their share respect to total production.   

Figure 3. Roundwood Production of Main Countries (FAO, 2010)

Comparison between Global and U.S Timber. 

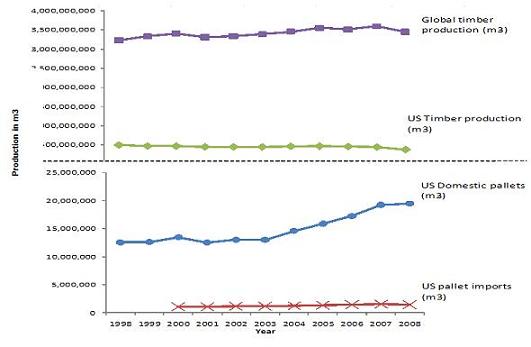
 For our research it is also important to identify information regarding domestic pallet production, global imports of pallets, and also, in order to know the state of timber stocks and production in all countries, data about the global and U.S. timber production was collected. This information is shown and compared in Figure 4.  

Figure 4. Timber and Pallet and Container Production in the U.S. and the World (FAO, 2010; U.S. Census Bureau, 2010)

Table 1 contains the data depicted in Figure 4. It can be seen that global timber production is slightly increasing over the decade of analysis, from 3.2 billion m3 in 1998 to 3.6 billion m3 in 2007. On the other hand, the timber production in the U.S. had decreased during the same time span. U.S. timber production represents approximately 13.5% of the global timber output. Domestic pallet production in the U.S. shows a significant increase from 2003 and 2008 years, of about 35%. Pallet imports to the U.S. have also increased, although to a much lower rate than domestic production, approximately 25 %. Imports represent 8.7% of the domestic pallet production in the U.S. 

Table 1. Pallets and Timber Production in the US and World (FAO, 2010; U.S. Census Bureau, 2010) 


References:   

  • FAO. (2010). FAO Statistics-US Hardwood and Softwood Roundwood Production.   Retrieved January 2010, from http://faostat.fao.org/site/626/default.aspx#ancor
  • FAO. (2010). FAO Statistics-Global Roundwood Production.   Retrieved January 2010, from http://faostat.fao.org/site/626/default.aspx#ancor
  • U.S. Census Bureau. (2010). Annual Survey of Manufacturers – Wood Pallet and Container Value of Shipment, Years 2000 to 2008. Retrieved January 2010, from Department of Commerce – Census Bureau: http://www.census.gov/manufacturing/asm/
  • U.S. Census Bureau. (2010, January 2010). Foreign Trade – Imports, Years 2000 to 2008.   Retrieved January 2010, from http://www.census.gov/foreign-trade/

Virginia Tech Department of Wood Science and Forest Products delivered a workshop on Energy Savings using Lean Thinking

by Henry Quesada, Assistant Professor
Virginia Tech


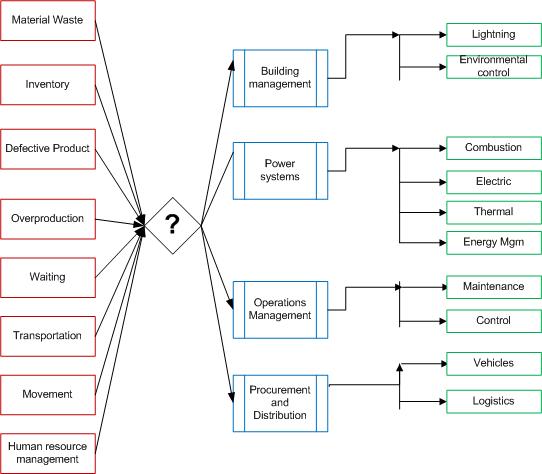
Representatives from private, goverment, non goverment, and academic sectors attended the workshop Energy Savings using Lean Thinking held at the Riverstone Energy Center in South Boston, VA.  This workshop delivered academic and practical applications on how industries in the wood products sector could decrease energy consumption by integrating lean thinking principles with energy management methods. Standard energy audits are oriented to the identification of energy management opportunities (EMOs) by looking at the power systems, building infraestructure, and control systems but most of the times they do not consider the impact of management practices in energy consumption. This workshop gave participants academic and practical guidelines in how to integrate lean thinking with energy reduction efforts. Figure 1 shows the model being developed at Virginia Tech.

Figure 1. Model to integrate Lean Thinking with Energy Management Opportunities

In the firs presentation, Mr. Mark Webber from Dominion reviewed the current status and future of energy in Virginia. The second presentation was given by Dr. Earl Kline from Virginia Tech on Lean Thinking Principles. After this, attendess were introduced to a Lean Energy Audit Toolkit (integraton of Lean Thinking concepts and EMOs) at macro level to identify what areas in their processes require inmediate attention, followed by examples of wood products industries that have achieved significant energy savings by eliminating waste in their processes. This presentation was given by Dr. Henry Quesada also from Virginia Tech.

Figure 2. Dr. Earl Kline from Virginia Tech discusses Lean Thinking Principles during the workshop

The last two presentations were practical approaches. Mr. Tyler Gill from Enernoc presented on Enernoc’s energy management platforms. Mr. Gill used a real-time example to demostrate how important is to constantly monitored energy consumption in order to identify potential EMOs. Finally, Mr. Shannon Walls from Masco Cabinetry Group presented results of how his Continous Improvement (CI) Group has identified, quantified, and implemented EMOs using CI methods. Overall, 64% out of the 23 attendees rated the workshop as excellent and 36% as good.

Please feel free to contact Dr. Henry Quesada at quesada@vt.edu if you have any questions about EMOs and integration with Lean Thinking concepts.

RESEARCH BRIEF: Innovation Metrics in the Public and Private Sector: a Quick Review

By Johanna Madrigal, Phd Candidate
Virginia Tech
Email: jmadriga@vt.edu


Measuring innovation is a very complex process (Secretary of Commerce, 2007) for the private and public sectors. The Oslo Manual (OECD 2002 and 2005) suggests a methodology to measure innovation based on two sets of guidelines to define what activities belong to innovation processes and how to measure them. The first set of guidelines proposes that innovation activities should be previously segregated in three large groups in order to be measured:

  • Research and Development (R&D) activities,
  • process and product innovation activities; these activities include, but not limited to acquisition of external knowledge, machinery, equipment and other capital goods, and other preparation activities, and
  • preparation for marketing and organizational innovation, covering all activities related to organization innovation other than R&D, such as, training, activities related to development and planning of new marketing methods and marketing instruments and the design of form and appearance of products (OECD, 2005).

The second set of guidelines is known as the Frascatti Manual (OECD, 2002) gives guidance on how to collect relevant data related to R&D activities, which are complemented by economic indicators developed by countries.

Now days, the United States government measures innovation activities based on data collected from two main reports developed by the Organization for Economic Cooperation and Development (OECD). These reports are:

  • the Science and Engineering Report which records the national volume of science and technology. Main indicators obtained from this set of data are the current status of R&D as a share of GDP and the R&D expenses per type or research; and
  • (2) the Business R&D and innovation survey that collects the data relevant to Research and Development in the industry, where the main indicator reflects the expenditure in R&D made by different business sectors and the ratio of R&D to sector sales.

These two reports have helped to develop economic indicators such as R&D expenditure as a share of the GDP, R&D expenditure per type of expenditure and the amount of patent and scientific and research article generated among others.

At the industry level, literature research about innovation measurement suggest that there is no standardize method to define innovation metrics, however, there is a clear agreement about the importance to measure innovation to show firms’s growth (Anthony et all 2007, Kuczmarski 2001, Muller et all, 2005). Managers around the world recognize that measuring innovation will help to make informed decisions based on real data and, also, will help on the strategies and action plans alignment for successful results (Muller et all, 2005).

There are numerous authors who recommended several innovation metrics inside companies, such as Anthony et all (2007) who suggested a mix of metrics divided in three phases:

  • In-put related measures
  • process and oversight metrics; and
  • output related metrics.

Also, McKinsey Global Surveys (2008) found out that business organizations are interested in using metrics across the whole innovation process, such as the number or people dedicated to innovation, the amount of new ideas from outside the company, the accomplishment of time schedule, financial returns from innovation, and customer service. In addition to the previous proposed innovation measurements for business organizations, the Boston Consulting Group (BCG 2008) also performed a study that found out metrics for four main factors. (1) start-up costs, (2) speed, (3) scale and (4) support costs

In summary, data available for further analysis about innovation at the industry level is quite limited (Secretary of Commerce, 2007), and mainly relies in the data collected by the U.S. government through the economic indicators as previously cited, and data collected by private organizations, such as McKinsey Global Surveys (2008), BCG (2008) and BCG (2009). Some of the metrics identify by these organizations are shown in Table 1.

Table 1. Innovation metrics (Adapted from BCG 2009)

Innovation phases
Metrics Inputs Processes Outputs
Number of new ideas

Business-unit investment by type of innovation

R&D ratio to company sales

Full time innovation technical staff

Idea generation time

Decision to launch time

Projects by type and launch date

Projects NPV

Patents granted

Launches by business area

Percentages of sales and growth from innovation projects

Innovation ROI

With this quick review, the author aims to summarize findings from the literature to give a general overview about innovation measures at the public and private sectors. However the innovation process is rather dynamic as new metrics and measuring tools are continuously being developed.

References

Anthony, S., Fransblow, S., and Wunker, S. (2007). Measuring the black box. CEO Magazine. December (2007), 48-51.

BCG (2008). Measuring Innovation 2008. Squandered Opportunities. Massachusetts: US. Boston Consulting Group, Inc.

BCG (2009). Measuring Innovation 2009. The need for action. Massachusetts: US. Boston Consulting Group, Inc.

Kuczmarski, T. (2000). Measuring your return on innovation. Marketing Management. 9 (1), 24-32

McKinsey Global Surveys. (2008). Assessing innovation metrics. New York: US. McKinsey and Company.

Muller,A., Välikangas, L. and Merlin, P. (2005). Metrics for innovation. Guidelines for developing a customized suite of innovation metrics. Strategy and leadership. 33 (1)

OECD. (2002). Fascati Manual. Proposed standard practice for surveys on research and experimental development. Paris:France. OECD Publication Service.

OECD. (2005). Oslo Manual, the measurement of scientific and technological innovations. Paris:France. OECD Publication Service.

Secretary of Commerce. (2007). Innovation measurement: tracking the state of innovation in the American Economy. Washington, DC: US. US Department of Commerce.