The Frascati Manual indicates that Research and Development (R&D) expenditures in The United States of America (USA) are classified by the North American Industry Classification System (NAICS) and under three research categories. These three categories are: (1)Basic research that covers all the experimental and theoretical work developing knowledge for the foundation of a topic but with no defined application or use; (2) Applied research which is knowledge developed through original investigation aiming an objective; and (3) Experimental development that is created under a systematic work, developing knowledge or using existing knowledge, targeting improvement of current material, products, process and services or the development new materials, products, processes and services. In 2008, R&D expenditures in the USA were approximately $397 billion. Out this total, basic research accounts for 17% ($69.15 billion), applied research for 23% ($88.59 billion), and development for about 60% ($239.89 billion) according to the National Science Foundation (NSF 2010).
At the industry level, these expenditures were mostly performed by the pharmaceuticals/medicines (NAICS code 3254), the semiconductor/other electronic components (NAICS code 3344), the communications equipment (NAICS code 3342), and Software publishers (NAICS code 5112) sectors. This last sector has the highest ratio of R&D as a share of sales. Table 1 shows the data corresponding to R&D expenses and sales for these industries (Wolfe, 2010).
Table 1. R&D expenses as a share of sales. (Wolfe, 2010)
Industry (NAICS code)
Sales worldwide ($ million)
R&D expenditure ($ million)
R&D as a share of sales
Semiconductor/other electronic components (3344)
192,258
28,812
15%
Pharmaceutical/medicines (3254)
529,601
69,516
13%
Communication equipments (3342)
132,307
14,987
11%
Software publishers (5112)
317,084
35070
11%
In the wood products industry data show that the primary wood products (NAICS code 321) and the secondary wood products sector (NAICS code 337) spent together $0.697 billion in 2008, which is less than 1% of total sales, similar to what happened in 2006 in this industry (Wolfe 2010). As a comparison, the overall ratio of R&D expenses to sales in the manufacturing industry in US was approximately 4% in 2006. This might be indicating that perhaps wood products industries need to increase their investments in R&D activities in order to increase their sales. Figure 1 shows a comparative chart of R&D expenditures as a ratio of sales for some industries including wood products.
Figure 1. R&D expenditure by selected industry (Wolfe, 2010)
This situation shown in Figure 1 might be an indication that R&D expenditures (as a measure of Innovation) must could be defined as a sustainable growth strategy for the Wood Products Industry if the business wants to remain competitive and profitable.
References:
National Science Board. (2010). Research and development: essential foundations for U.S. competitiveness in a global economy. A companion to Science and Engineering Indicators – 2008. NSF.
Wolfe, R. (2010). U.S. Businesses Report 2008 Worldwide R&D expense of $330 billion: findings from new NSF survey. NSF. 10, 322
In the future, there will be a greater need for international forest products in Central America due to increasing population size, deforestation, and tourism. According to Salamone (2000), “the United States forest product companies have overlooked Central America as an opportunity to expand their markets.” Due to improvements in health care, sanitation and education the Central American population has almost quadrupled from 11 million in 1950 to 40 million in 2008 (Fox 1990; World Bank 2010).
Deforestation has been and continues to be a major issue today for all Central American countries. The Panamanian government removed Law No. 7 that provided tax incentives for landowners to reforest their properties. This removal resulted in illegal logging and a decrease of reforestation projects (Munoz 2007). The natural forests of Costa Rica have been exploited due to shortages of wood for housing and furniture (Montagnini et al 2003).
Even in a global recession, tourism has been growing in Central American countries. Nicaragua had an 11% increase in tourists in the first five months of 2009 (Rogers 2009) and in the first year of breaking ground for the expansion of the canal in 2007, Panama has experienced an 11.2% increase in investment for tourism. Another example is Ecotourism, that has played a big part in Central America’s tourism trade since 8% of the world’s animal and plant species live in Central America (Schieber 2009). More wood products will be needed as tourism increases in Central America; a shortage of hotel rooms was observed in 2007 due to a 19% increase in tourism since 2005 (Fallas 2008).
The purpose of this research is to evaluate potential market opportunities for Virginia forest product companies in Central America.
Virginian forest product companies have reduced the amount of wood products and furniture exported to Central American countries (Figures 1 and 2) because past unstable financial markets, higher freight rates, tighter credit lines, and soft housing markets (VDACS 2008). The North American Industry Classification System (NAICS) for wood products manufacturing (321) and furniture and related products manufacturing (337) exported from Virginia to Central America is shown is Figures 1 and 2, respectively.
Figure 1. Exports of NAICS 321 from Virginia to Central American Countries
In 2009, Guatemala, El Salvador and Honduras were the only Central American countries importing wood products from Virginia (Figure 1). Most Central American countries increased in amount of furniture and furniture parts being imported from Virginia in 2009, except for Panama (Figure 2).
Figure 2. Exports of NAICS 337 from Virginia to Central American Countries
In spring 2010, the research team from Virginia Tech visited top forest product importers in Panama and Costa Rica. The objectives for the visit were to (1) investigate local production, (2) investigate local demand, (3) identify potential trade barriers, and (4) look into the future demand and production for wood products.
Methods
Personal interviews were conducted with Costa Rican and Panamanian forest product companies, and governmental and non-governmental agencies. Two questionnaires were developed from secondary research of the Central American forest product market.
Results
The Costa Rican and Panamanian governmental officials stated that their governments do not promote the use of wood products in their country. Due to lack of government support the state of the forest products industry in Panama has declined since 1993 and today only 5 companies exist with more than 50 employees in Panama. The forests are owned by the government and a request to harvest must be submitted to the Panamanian forestry agency. Most of the land available for planting high valued timber species has disappeared because of urbanization. The remaining available land has poor quality soils and is not sufficient for planting.
The wholesalers interviewed in both countries had 100-500 employees on average, with one wholesaler with over 2,000 employees. The wholesalers’ wood product lines currently consists of cabinets, flooring, furniture, millwork, and home improvement items. Their customer, base which primarily uses insect and decay resistant cement and steel, consists of retailers, homeowners, contractors, and government offices. Historically these items have been preferred building materials because of the hot and humid climate in Central America, but cement and steel require a lot of energy and produce large amounts of carbon dioxide and other pollutants during the manufacturing process. The Costa Rican Government has mandated that the country be carbon neutral by 2021; this gives wood product companies an opportunity to expand more into building construction.
Figure 3. Pine lumber supply at a Costa Rican forest products wholesaler. Author’s Photo
The companies interviewed largely import pressure treated lumber, softwood lumber (10-15 containers/month), panels (1-10 containers/month), hardwood veneer (1-10 containers/month), flooring, and furniture/parts (1-10 containers/month). Some of the wood product wholesalers conducted business with wood product brokers in the U.S. for softwood lumber (Southern yellow pine) and panels, but all of the buyers were familiar with Southern yellow pine lumber from the United States. The companies in Panama and Costa Rica primarily import softwood lumber from Chile (See Figure 3), Brazil, Honduras, and Uruguay, which is dried to 12-14% moisture content. Imported panel products consist of oriented strand board (OSB), plywood, medium-density fiberboard (MDF), particle board, and B-B plywood; Oiled face & Edge-Sealed edges (BBOES) plyform.
The majority of the buyers were familiar with Appalachian hardwoods and they were willing to import them if they were competitively priced with native tropical hardwood species in the region. Appalachian hardwoods can be used in doors, mouldings, cabinets, furniture, flooring and ceiling panels. Flooring and furniture are primarily manufactured by using dark reddish species, therefore, black cherry (Prunis serotina) and black walnut (Juglans nigra) from the Appalachian region could be a substitute for the tropical hardwood species currently used, such as Guanacaste (Enterolobium cyclocarpum) (Figure 4).
Figure 3. Comparison between Appalachian hardwood species to a native tropical species. From left to right: Guanacaste (Enterolobium cyclocarpum), Black Cherry (Prunus serotina), Black Walnut (Juglans nigra)
Transportation issues were addressed during the interviews. Wholesalers reported that logistics was not a problem when importing wood products. Products arriving to Panama primarily enter the country at the Panama City port. In Costa Rica, the products can arrive at two locations: Caldera Port, Puntarenas on the Pacific coast and Port of Limón on the Caribbean coast.
Conclusions
This research supports the claim that United States forest product companies have not put enough effort into entering the forest product market in Panama and Costa Rica. Main conclusions indicate that the majority of the general public is unfamiliar with the properties and uses of wood as a building material since steel and cement are the currently preferred building materials. Forests in Panama and Costa Rica are not being harvested and the industry lacks support from the government, causing a reduction in the amount of raw material and production. An outside source of wood is needed to meet the needs of a growing region infrastructure.
References
Fallas, H. 2008. Country Caters to Tourists with Tight Supply of Rooms. La Nacion. Section of Economy. March 10. Available at: http://www.nacion.com
Montagnini, F. et al. 2003. Enviornmental Services and Productivity of Native Species Plantations in Central America. XII World Forestry Congress, 2003. Quebec City, Canada.
Munoz, M. 2007. Menejo Forestal en Panama. La Presna. November 25, 2007. Available at http://biblioteca.presna.com/contenido/2007/11/25/25-portada1.html
Quesada, H., R. L. Smith & J. Stopha 2009. Market Opportunities for Virginia’s Wood Products in Central America. Federal-State Marketing Improvement Program Grant.
Rogers, N. 2009. Tourism Grows Despite Worldwide Slump. The Nica Times. July 24-30, 2009. Available at:http://www.nicatimes.net/nicaarchive/2009_07/0724091.htm
Salamone A. 2000. Opportunities in Central America. Available at: http://www.fas.usda.gov/ffpd/wood-circulars/jun00/camerica.pdf
Schieber, B. 2009. Guatemala at The International Tourism Trade Fair, FITUR 09. The Guatemala Times. January 28, 2009.
Virginia Department of Agriculture and Consumer Services (VDACS), 2008. Virginia Forest Products Export News. Fall-Winter 2008. Available at: http://www.vdacs.virginia.gov/international/pdf/forestnews.pdf
Virginia Economic Development Partnership (VEDP), 2008. Wood Products In Virginia. Available at: www.yesvirginia.org
World Bank, 2010. Country Data Profile. The World Bank Group. Available at: http://ddp-ext.worldbank.org/
Many furniture manufacturers do not have an efficient engineering process. As a result, problems are usually reflected as longer processing times for drawings that leads to production delays, high engineering errors rate affecting product quality, and excessive changes, higher costs and excessive waste. Presently, furniture manufacturers are trying to implement effective Lean Thinking methodologies for manufacturing process to reduce cost, improve quality, and shorten lead time in order to increase their competitiveness – This research utilizes value stream mapping (VSM) and simulation methods to implement a lean management application in the engineering process for wood furniture companies.
The application of Lean Thinking
Lean thinking principles encompass systematic approaches both on management level (Keyte & Locher 2004) as well as manufacturing level (Womack & Jones 1996). Lean management helps people to implement lean transformations in supporting processes such as accounting, engineering, customer service, and sales other than manufacturing. Lean Thinking, of course, can perform a lean transformation for a production process such as molding, fabricating, packaging, and finishing.
The role of engineering
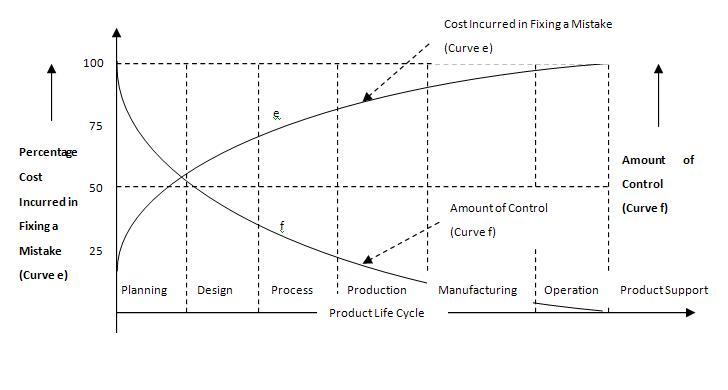
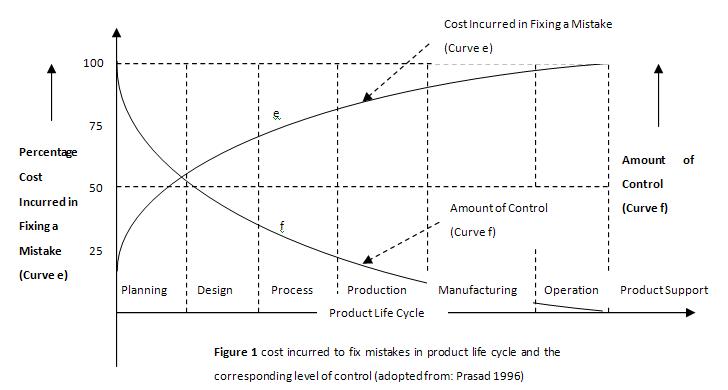
Engineering takes into effect at an early stage of product life cycle, bridging the design and manufacturing transforming a design idea into a production reality. Thus, it plays an important role to reduce cost (either product development cost or manufacturing cost), ensure quality, and time-to-market. In Figure 1, we could see that, cost incurred in fixing mistakes increases from early stages to late stages of product life cycle while the amount of control decreases at the same period.
Figure 1 cost incurred to fix mistakes in product life cycle and the corresponding level of control (adopted from: Prasad 1996)
Value stream mapping (VSM)
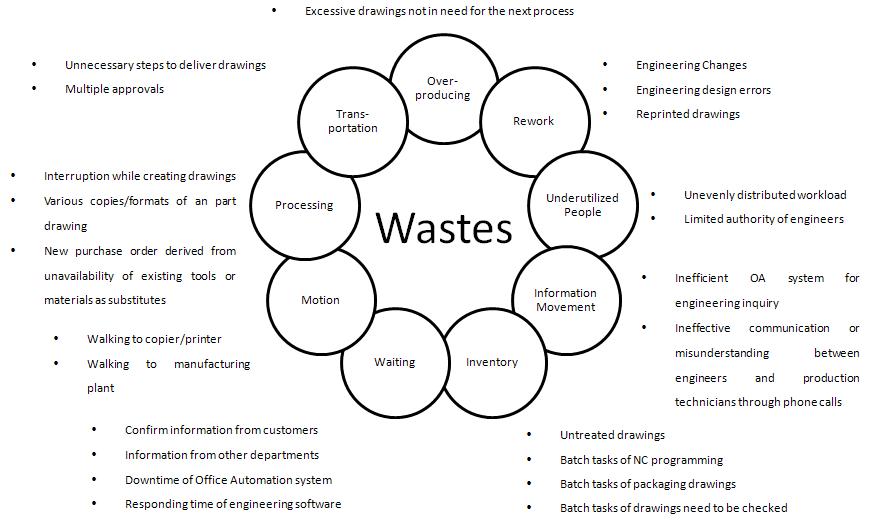
Value stream mapping (VSM) is a useful lean implementation tool to help people identify both value-added and non-value-added activities in a process and eliminate wastes for process improvement. Figure 2 shows nine types of wastes in a furniture engineering process based on preliminary study. Figure 3 presents a simple furniture engineering process.
Figure 2. Engineering wastes in wood furniture industry adopted from (Ohno 1998; Prasad 1996; Keyte and Locher 2004)
Some furniture engineering processes, such as “create drawings”, always take a long lead time. Some reasons lead to this scenario could be due to the various interruptions to engineers when they create drawings, multiple approvals process, large batch sizes of tasks, or excessive engineering changes.
Figure 3. Current siimplified VSM for a furniture engineering process
These kinds of activities do not create value toward customer which should be eliminated or improved. Next step, we will focus on precisely measuring each value-added process and non-value-added process by mapping a complete current state VSM of the case study company, and then focus on how to eliminate the wastes in the process by applying appropriate lean tools. Specifically, we will follow Lean Think principles (Womack & Jones 1996) to incorporate the Lean Engineering process:
“Specification value” – specify the value that defined by the customer, but not by the engineers or any other people within the organization.
“Identify the value stream” – figure out all the processes involve in delivering engineering documents to internal customers. “Flow” – create continuous value-creating steps flow and reduce batch sizes for a single-task process.
“Pull” – pull the value from customer. Every process along the engineering value stream should be aligned with customer’s needs and satisfy these needs when it is needed.
“Pursue Perfection” – lean principles endlessly strive for perfection, avoiding unnecessary waste and errors in the processes and keep implementing continuous improvements.
Leslie Scarlett Sanchez, MS CandidateDepartment of Wood Science and Forest ProductsVirginia TechPallets in the U.S. Market
The growth of international trade in the last decades created the need to improve not only transportation infrastructure and technology, but also the elements used during transportation process such as handling, loading, unloading, warehousing. One of these elements is the pallet. Pallets and containers play an important role in the movement of goods from place to place. They are not only used in warehouses or commercial centers, but also in all those activities that require an efficient way of transportation. Pallets allow reducing time and cost in an efficient manner, facilitating handling and transportation of raw and in-process materials, or finished products from the supplier to the manufacturer, from the manufacturer to the wholesaler, and then to the retailer. About 450 million new pallets are manufactured in the US each year, 1.9 billion are in use in the U.S. each year, and 300 million pallets are recovered by pallet recyclers each year.
Pallets definition
Pallets are the interface between packaging and the unit load handling equipment (White & Hamner, 2005). Another simpler definition is that pallets are “portable platforms”, which facilitates the movement and storage of unitized goods (Kator, 2008).
Unit loads are also important to define, as the system comprised of pallets, packaging materials, and unit load stabilizers (stretch wrap, tie sheets, corner posts, load adhesives, and strapping). Figure 1-1 shows two examples of pallets and unit loads.
Figure 1-1. Pallets and Unit load
Wood Pallet and Containers Imports in the U.S. Market
According to the North American Industry Classification System (NAICS), the Wood Pallet and Container product class is represented by the following sub-classes which show percentages, representing the average share of each sub-class on the total value of shipments for years 2002 to 2006. Wood pallets and containers, and wood-metal combinations made up 62% of the total product class’ value of shipments.
Figure 1‑2. Share of Product Sub-Categories on Wood Pallet and Container Manufacturing Product Class (based on value of shipments, Census Bureau 2009)
U.S Domestic Production
The U.S. domestic production is showed in the figure 1-3 bellow. It is evident from Figure 1.3 that exists an increase over the years. In 2000 the domestic production was $ 4,8 billion and for 2007 was 7,2 billion representing a 49% of increase in 7 years.
Figure 1-3. U.S. Pallet Domestic Production (Census Bureau 2009)
U.S. Imports
Figure 1-4 shows the total imports and value of shipments (domestic production) of wood pallets and containers, and the share of imports over total domestic consumption. The later was obtained by adding imports and value of shipments. The value of product shipments (domestic production) has grown from about $5 billion to $7.2 billion over the 8-year period. Imports have stayed almost constant throughout those years. As a result, the share of imports on the domestic consumption of wood pallet and containers, has decreased, from 7.7% in year 2000 to 7.1% in year 2007; a drop of 8%.
Figure 1-4. Wood Pallets and Container Imports and Domestic Production (Census Bureau 2009)
Regarding countries of origin for imports, Figure 1-5 shows the ten major exporters of Wood pallets and containers to the U.S. from year 2000 to 2008.
Figure 1-5. Ten Major Country Exporters of Wood Pallets and Containers to the U.S. in the year 2008 (Census Bureau 2009)
Strategic frameworks are a set of ideas and guidelines to increase the efficiency of your internal business processes and to raise customer satisfaction levels. Strategic frameworks can be classified into three different categories: process improvement, organizational management, and process automation. Process improvement frameworks focus on the improvement of internal processes in a firm such as manufacturing, procurement, human resources, financial, and distribution. Organizational management frameworks aim to help a firm to better organize the company’s overall strategy. Automation frameworks are related to the implementation of information technology solutions to increase the productivity, communication, and synchronization of all internal business processes with external entities such as customers and suppliers.
The business process improvement framework by the American Productivity and Quality Center (APQC)
Process improvement frameworks such as Lean Thinking, Six Sigma, Supply Chain Management, and Theory of Constraints have been commonly adopted in many manufacturing and service industries. In this workshop, we will give you the basics of each of the most important process improvement frameworks. We will also introduce other strategic frameworks such as Value Chains, Business Process Management and Enterprise Resources Planning to help you develop a strategy to implement your process improvement framework. We have carefully selected a list of speakers that bring academic credibility in combination with industry expertise.
Workshop outline (subject to change)
Strategic Frameworks, Henry Quesada, Operations Research Assistant Professor, Department of Wood Science and Forest Products
Six Sigma, Johanna Madrigal, Six Sigma Green Belt and PhD Candidate, Department of Wood Science and Forest Products
Lean Thinking, Earl Kline, Operations Research Professor, Department of Wood Science and Forest Products
Supply Chain Management, Jaime Camelio, Operations Research Assistant Professor, Department of Industrial Systems Engineering
Business Process Management, Henry Quesada
Enterprise Resource Planning, Roberta Rusell, Business and Information Technology Professor, Pamplin School of Business
Roundtable discussion
Workshop Objectives:
Understand the basic concepts of the most important process improvement frameworks.
Learn how to integrate different process improvement frameworks using Business Process Management.
Understand which process improvement framework is a better fit for your own business.
Discover the impact of automation frameworks to increase your internal processes productivity.
Who should attend:
Plant Managers, Quality Engineers, Process Engineers, Procurement Managers, Supplier Chain Managers, Purchasing Managers, Plant Engineers, Small and Medium Enterprise Managers.
Anyone interested in learning the basics of Process Improvement
Unique value of the workshop
Attendants will have the opportunity to understand the main advantages and disadvantages of the most common process improvement frameworks.
Participants will be given details to understand what process improvement framework could best fit their own firm’s business model.
Participants will be given examples and practical applications to better understand the process improvement framework concepts.
Location, date and registration:
Date: October 22, 2010
Time: 9:00 a.m. to 2:00 p.m.
Location: Brooks Center, Virginia Tech, Blacksburg, VA
Investment: $35. Includes coffee breaks and workshop materials.


